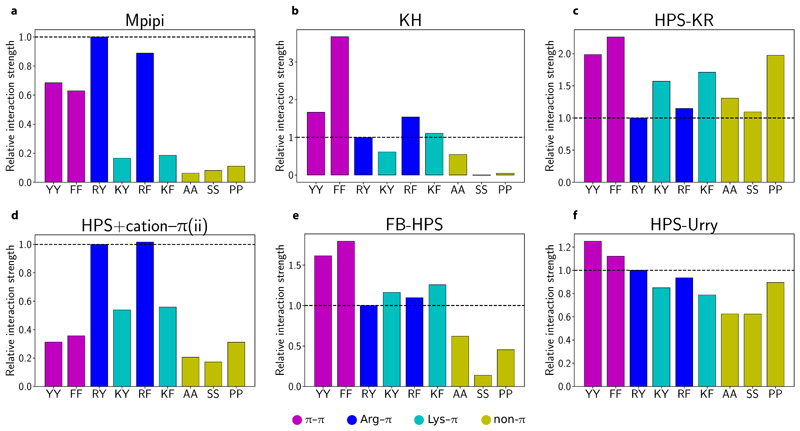
Figure 5. Recapitulating the phase behaviour of A1-LCD variants.
a Nine variants of the A1-LCD (including the wild-type) are studied in this work. Variants are prepared following Bremer et al. [10] Experimental critical temperatures are estimated as described in SI Sec. S2.2. The colour of each variant used in panel a is also used in all remaining panels. b–g Phase diagrams for A1-LCD variants obtained via direct-coexistence simulations using the Mpipi, KH, HPS-KR, HPS+cation–π(ii), FB-HPS and HPS-Urry models, respectively. Estimation of critical points of simulated phase diagrams is described in the Methods section. Curves are derived from empirical fits of the data to Eqs (6) and (7); typical errors are discussed in SI Sec. S8.4. h–m Simulated critical temperature Tc relative to the critical temperature of the wild type shown against the experimental analogue. The Pearson correlation coefficient r and the root mean squared deviation D are provided above each graph. The red lines correspond to a perfect fit to the experimental data, while the black lines represent the linear regression fit.

