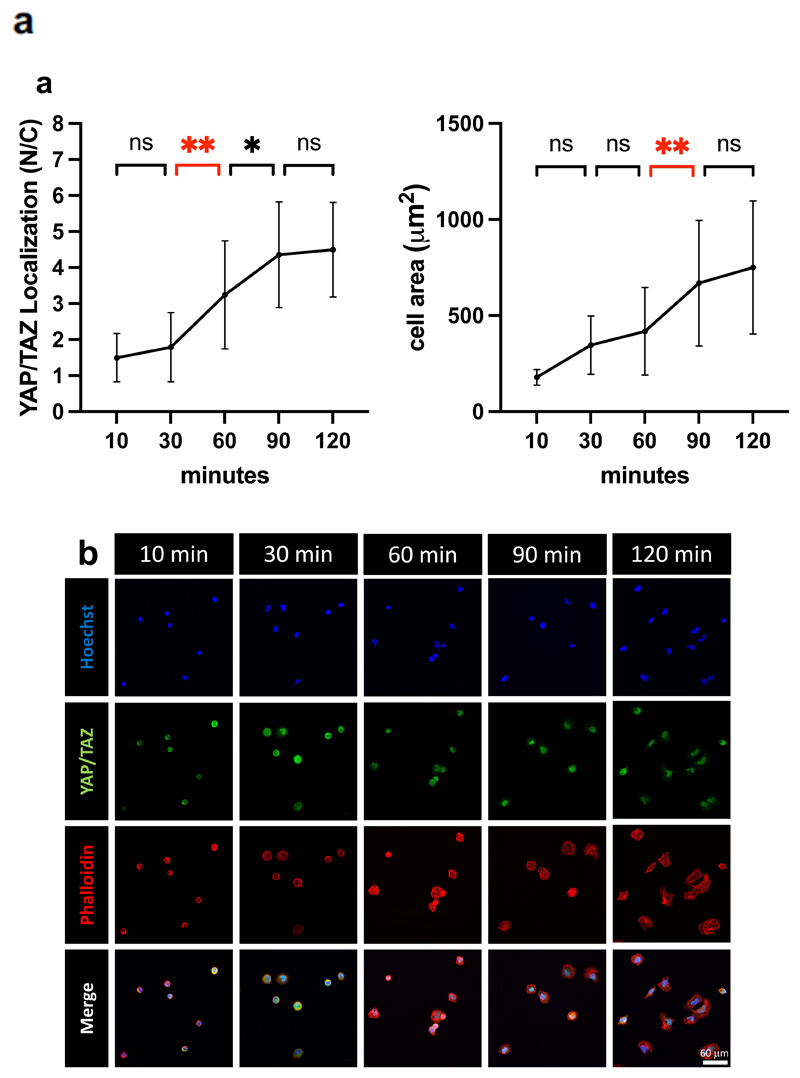
Figure 4.
a) Quantifications of the ratio nuclear/cytoplasmic YAP/TAZ subcellular localization in U2OS plated on PEG-RGD hydrogels at three different values of stiffness and RGD concentration. Statistically significative differences were evaluated comparing two groups performing a one-way ANOVA with Tukey’s multiple comparison test using GraphPad Prism 9 and considering a confidence interval of 95% (p-values obtained comparing: lanes 1 vs. 3, p=0.99; lane 4 vs. 6, p<0.001; lane 6 vs. 7, p=0.3; lane 7 vs. 9 p<0.0001). b) Immunofluorescence of U2OS plated on PEG-RGD hydrogels at three different values of stiffness and RGD concentration. From the staining are visible: nuclei (in blue), F-actin (in red), YAP/TAZ (in green). F-actin was stained with fluorescently-labeled phalloidin to serve as cell shape reference. Single cell immunofluorescence is reported in Figure S6. Number of cells for each lanes are: lane 1: 56; lane 2: 41; lane 3: 27; lane 4: 49; lane 5: 42; lane 6: 52; lane 7: 49; lane 8: 41; lane 9: 69.

