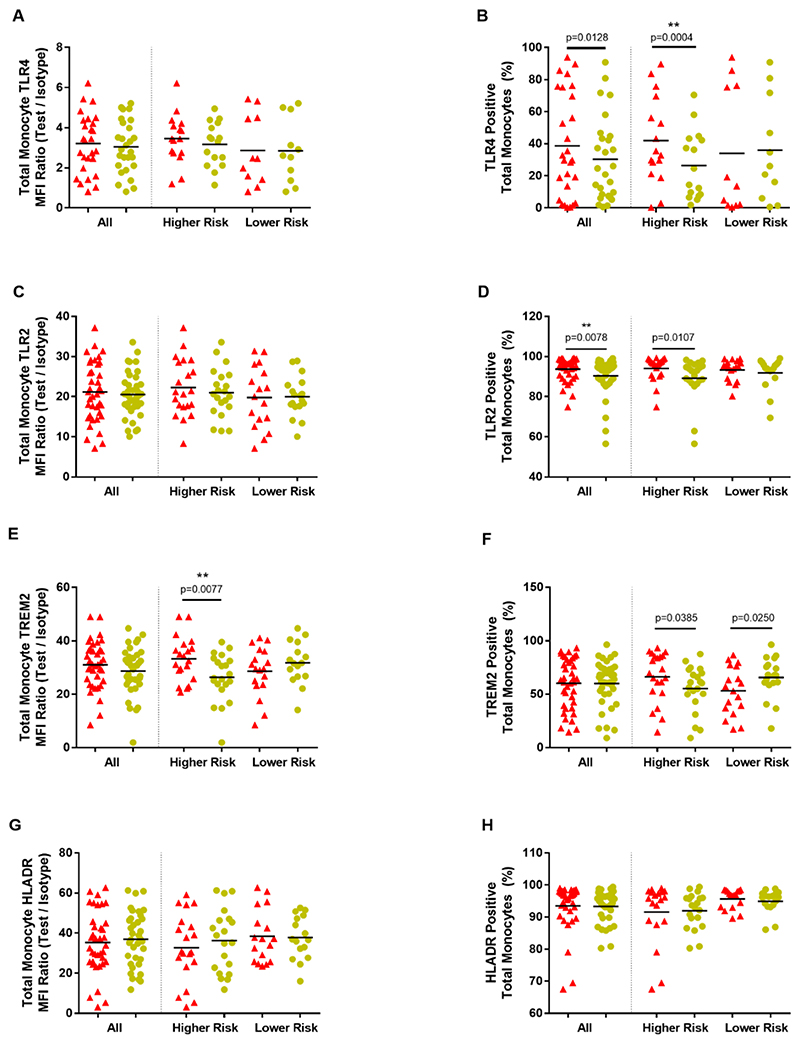
Figure 2. Monocyte surface markers.
Total monocyte marker expression in Parkinson’s disease cases versus paired controls; overall and within risk groups. Graphs showing total monocyte MFI (Median Fluorescence Intensity) ratios (Test/Isotype) ((A), (C), (E), (G)) and percentage monocytes positive ((B), (D), (F), (H)). (Parkinson’s disease=red; Controls=yellow). **significance withstood Bonferroni correction for multiple testing within the relevant category.

