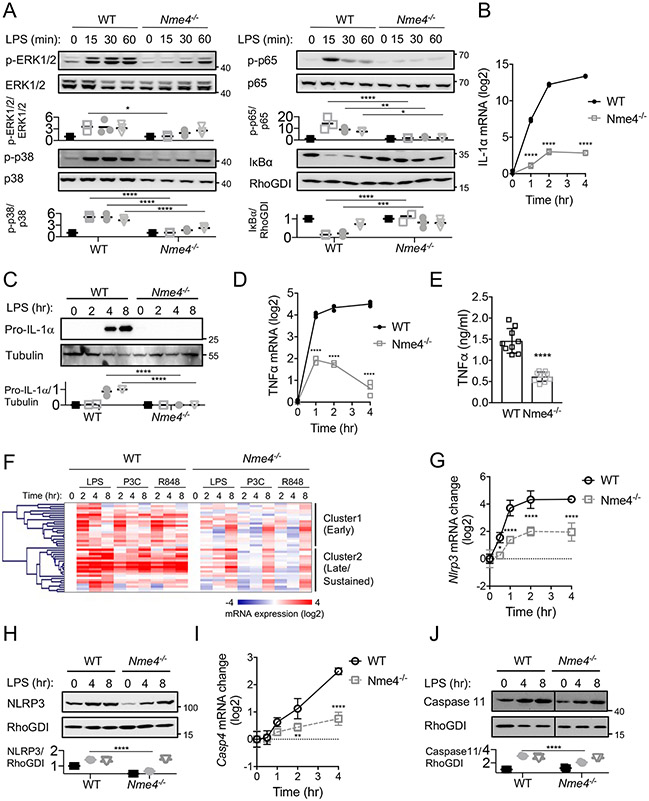
Figure 3: Nme4 mediates TLR signaling and transcriptional response.
(A) WT or Nme4−/− RAW264.7 cells were treated with 100 ng/ml LPS for 0, 15, 30, 45, 60 min and immunoblotted for NF-κB phosphorylation (p-p65), IκB protein levels, ERK phosphorylation and p38 phosphorylation. Total protein levels for p65, ERK1/2, p38 and RhoGDI were assessed as loading controls and relative change quantification is plotted. (B-E) WT or Nme4−/− RAW264.7 cells were treated with 100 ng/ml LPS for the indicated times and Il1a and Tnf mRNA were quantified by qPCR, (C) pro-IL-1α protein expression was analyzed by western blot 0, 2, 4 and 8 hr after stimulation (tubulin blot serves as a gel loading reference) and (E) TNFα secretion at 4 hr was measured by ELISA. (F) Transcriptional response to TLR ligands LPS (100 ng/ml), P3C (1 μg/ml), R848 (5 μg/ml) in WT and Nme4−/− cells 0, 2, 4 and 8 hr after stimulation. mRNA levels were assayed by Fluidigm microfluidic RT-PCR and gene expression patterns were analyzed by hierarchical clustering (Pearson uncentered). (G-J) WT or Nme4−/− RAW264.7 cells were treated with 100 ng/ml LPS for the indicated times and Nlrp3 and casp4 mRNA were quantified by qPCR (G, I). NLRP3 and Caspase11 protein expression was analyzed by western blot 0, 4 and 8 hr after stimulation (RhoGDI serves as a gel loading reference) and quantification is plotted (H, J). Data shown are representative of three (A-E ,G-J) or two (F) independent experiments, and expressed as mean ± SD (A -E, G-J). (A-D, G-J) Two-Way ANOVA followed by Sidak’s multiple comparison test; *p < 0.05, **p < 0.01, ***p < 0.001, ****p < 0.0001, n=3. (E) Welch’s two-tailed t-Test; ****p < 0.0001, n=9.

