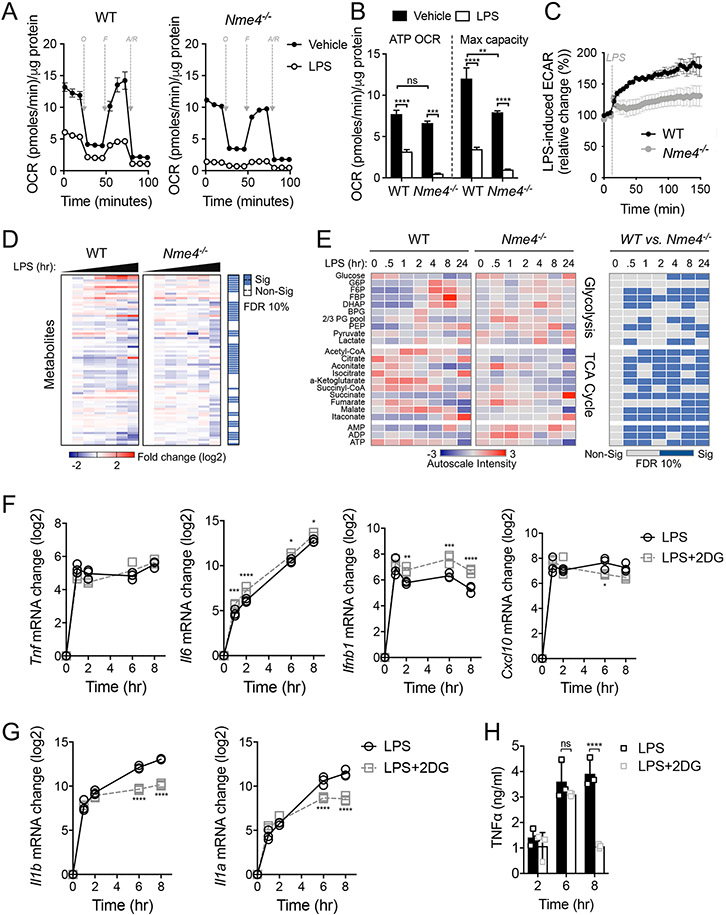
Figure 4: Nme4 is required for glycolytic commitment induction in LPS-stimulated macrophages.
Representative Seahorse mitochondrial stress test measuring OCR (A) and mitochondrial OCR (B) after 24 hr of 100 ng/ml LPS administration in WT or Nme4−/− RAW264.7 cells. O = oligomycin (1 μM), F = FCCP (2 μM), R/AA = Rotenone (0.1 μM) and antimycin A (1 μM). (B) A bar graph showing quantified protein normalized mitochondrial OCR from stress test in (A). (C) Real time ECAR measurement in WT or Nme4−/− RAW264.7 cells injected with LPS to a final concentration of 100 ng/ml. (D-E) WT or Nme4−/− RAW264.7 cells were treated with 100 ng/ml LPS for 0, 0.5, 1, 2, 4, 8 and 24 hr and the metabolic profile was determined by LC-MS. (D) Log2 fold change on the mean and significance level between groups from an ANOVA2 comparison for time and group variance. (E) Auto-scaled intensity and significance by t-test of the normalized signal from central metabolite signals associated with glycolysis and the TCA cycle over the course of activation. (F-H) WT RAW264.7 cells were treated with LPS (100 ng/ml) in the presence or absence of 2-DG (5 mM) for the indicated times. (F) Tnf, Il6, Ifnb1, Cxcl10 and (G) Il1b and Il1a mRNA were measured by qPCR, and (H) secreted TNFα was measured by ELISA. Data are representative of two (D-E) or three independent experiments (A-C, F-H), and expressed as mean ± SEM (A, C) or mean ± SD (B, F-H). (D-E) Statistical testing was corrected for multiple comparisons using the Benjamini-Hochberg method with a false discovery rate of 10 % equating to p-values of 0.062 for (D), 0.019, 0.047, 0.053, 0.030, 0.067, 0.061 and 0.061 for 0, 0.5, 1, 2, 4, 8 and 24 hr respectively (E). (B, F-H) Two-Way ANOVA followed by Sidak’s multiple comparison test; *p < 0.05, **p < 0.01, ***p < 0.001, ****p < 0.0001. (A-C, D-E) n=6 (D-F) n=3.

