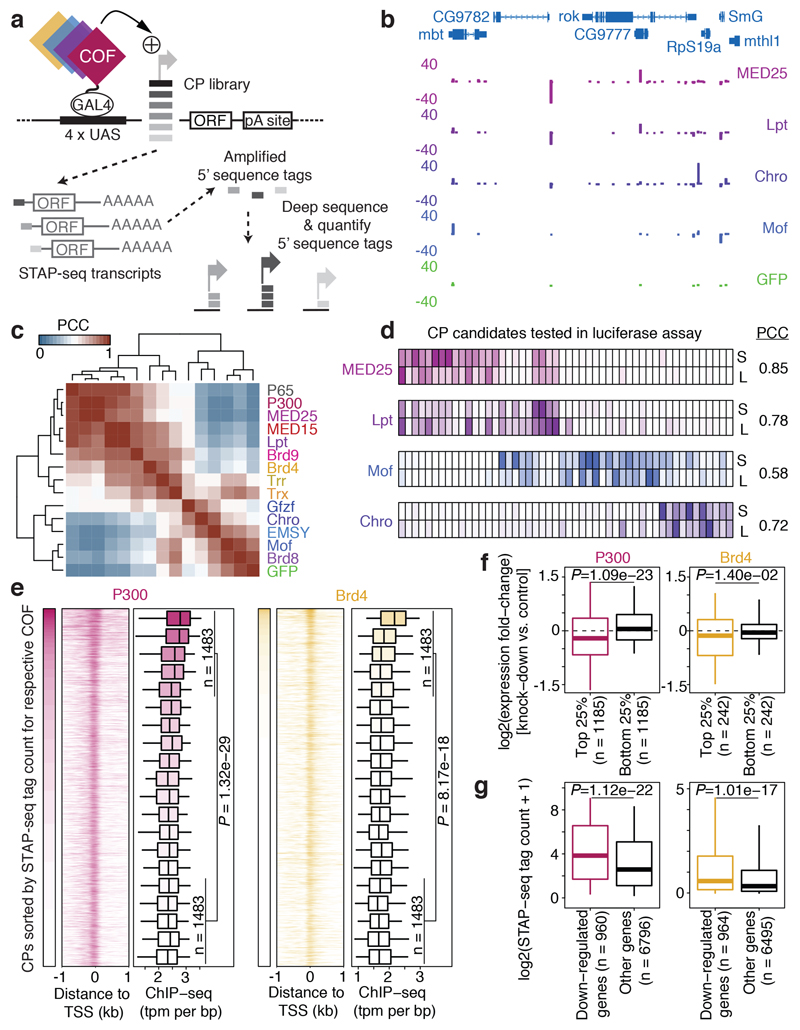
Figure 1 |. Differential activation of core promoter candidates by transcriptional cofactors.
a, Schematic overview of the COF-STAP-seq high-throughput promoter-activity assay. Cofactors (COFs) are recruited one-by-one via a GAL4-DNA-binding domain to a core-promoter (CP) candidate library; reporter-transcript tags are quantified by sequencing. b, Transcription from CPs activated by four COFs and GFP in a representative genomic locus (negative values: antisense transcription). c, Hierarchical clustering of COFs based on Pearson correlation coefficients (PCCs) of COF-STAP-seq tag counts across 30,936 CPs activated by at least one COF. d, Heatmap of STAP-seq (S) and luciferase (L) signals for activation of 50 CPs by four COFs (right: PCCs between STAP-seq and luciferase values; see Extended Data Figure 3d). e, COF binding in S2 cells to 5,933 CPs active in COF-STAP-seq and endogenously. Per COF, CPs are sorted by STAP-seq activation (left) and ChIP-seq coverage is shown in heatmaps and boxplots (-150 to +50bp window around the TSS; n=297 independent CPs per box; box shading: mean STAP-seq tag count) f, Expression fold change upon COF inhibition for genes associated with top and bottom 25% COF-STAP-seq CPs for the respective COF. g, COF-STAP-seq tag count for CPs of genes down-regulated upon COF inhibition and CPs of all other genes. (e-g) considering only CPs (or genes) active in COF-STAP-seq and endogenously in S2; data reanalysed from refs in Supplementary Table 1; n denotes number of independent CPs; boxes: median and interquartile range; whiskers: 5th and 95th percentiles; P values: one-sided Wilcoxon rank sum test.

