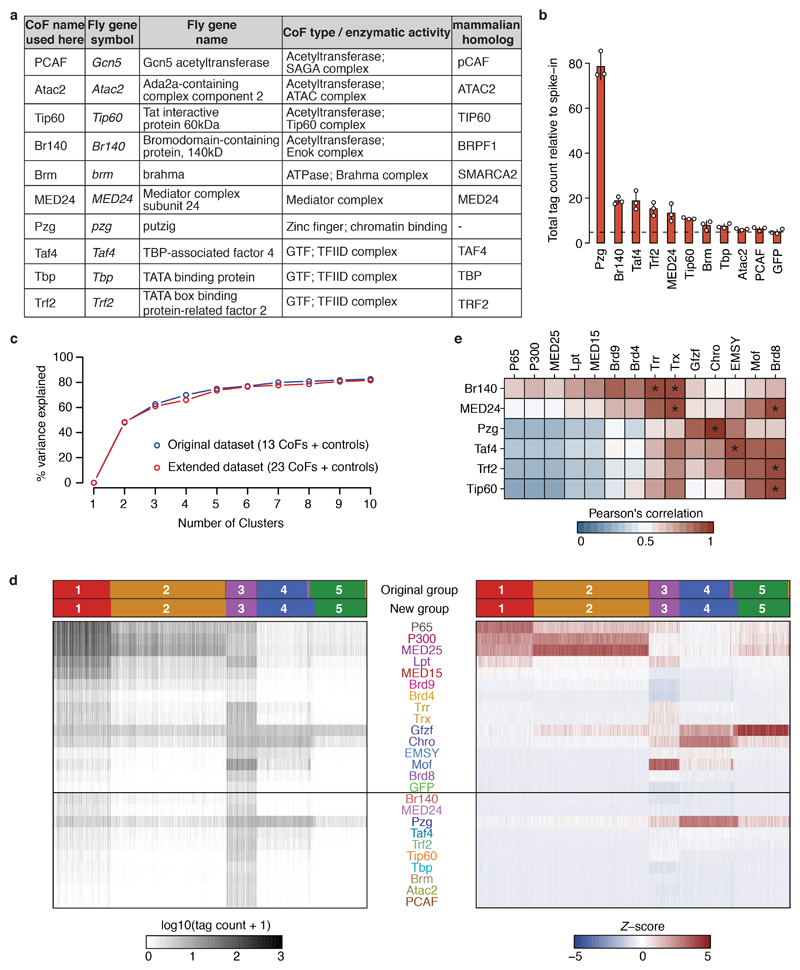
Extended Data Figure 7 |. Core-promoter preferences of ten additional cofactors.
a, List of ten additionally tested Drosophila melanogaster cofactors (COF). For each COF, relevant information about its function is shown (functional domain / enzymatic activity / protein complex) and the name of the respective mammalian homolog. b, Total COF-STAP-seq tag counts relative to spike-in for GFP (negative control) and the ten COFs. Bar heights: mean counts; error bars: standard deviation (SD); n=3 independent biological replicates per COF. c, Percent of variance in the data explained by clustering core promoters (CPs) into different number of clusters with k-means (k ranging from 1 to 10) using the original dataset containing 13 COFs, P65 and GFP (as in Extended Data Figure 6b; blue) or the extended dataset with 10 additional COFs (23 total; red). The curves are highly similar for both datasets, i.e. the same number of clusters explains the same amount of variance in both the original and the extended dataset. d, as Extended Data Figure 6a but for extended dataset of 23 COFs: spike-in normalized STAP-seq tag counts (left heatmap) for 30,936 CPs (columns) clustered based on their preferential activation by 23 different COFs and 2 controls (rows). Tag counts were transformed into Z-scores (right heatmap), which were used to cluster CPs into 5 clusters with k-means. For comparison, groups defined on the dataset containing 13 COFs and 2 controls (Extended Data Fig. 6a) are shown in the top row and groups defined with this extended dataset are shown below. e, Correlation between each of the six activating COFs in the extended dataset and the 13 COFs of the original dataset. Pearson’s correlation coefficients ≥ 0.9 are marked by an asterisk.

