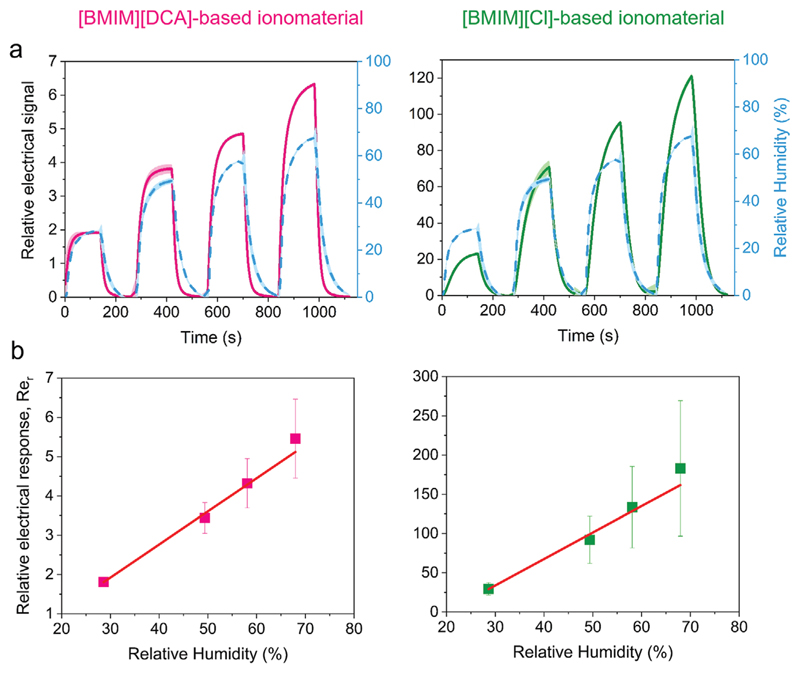
Figure 3. Analysis of the electrical response to humidity of [BMIM][DCA] and [BMIM][Cl] ionomaterial thin films.
a) Relative electrical signal upon exposure humidification-drying cycles to increasing RH levels. The blue dashed line represents the variation of RH. The full lines and shadows represent, respectively, the average and standard deviation of 5 humidification–drying cycles to each RH level. b) Variation of the sensors relative electrical response (Rer) as a function of the RH level. For [BMIM][DCA] ionomaterials, Rer = 0.084 RH – 0.607, R2 = 0.995 (n = 15) and for [BMIM][Cl] ionomaterials, Rer = 3.373 RH - 67.395, R2 = 0.988 (n = 15).

