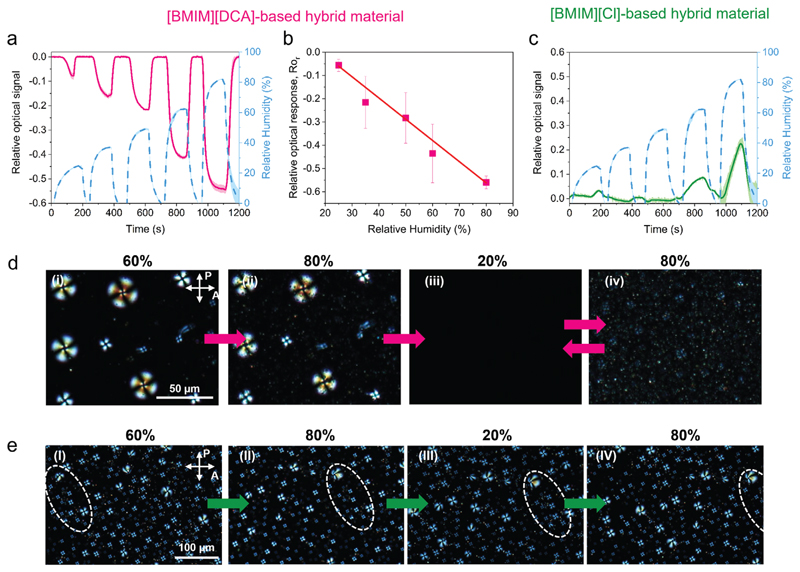
Figure 6. Analysis of the optical response to humidity of [BMIM][DCA] and [BMIM][Cl] hybrid material thin films.
a,c) Relative optical signal upon exposure to humidification–drying cycles with increasing RH levels. The blue dashed line represents the variation of RH. The full lines and shadows represent, respectively, the average and standard deviation of 5 humidification-drying cycles to each RH level. b) Variation of the relative optical response (Ror) as a function of the RH level (n = 12), Ror = -0.009 RH + 0.168, R2 = 0.996. d) POM images with crossed polarizers of a [BMIM][DCA] hybrid film during sequential exposure to humid nitrogen with RH varying between: i) 60% (room conditions), ii) 80%, iii) 20%, and iv) 80%. e) POM images with crossed polarizers of a [BMIM][Cl] hybrid material film during sequential exposure to humid nitrogen with RH varying between: I) 60% (room conditions), II) 80%, III) 20%, and IV) 80%; the dashed circles represent movement of the droplets.

