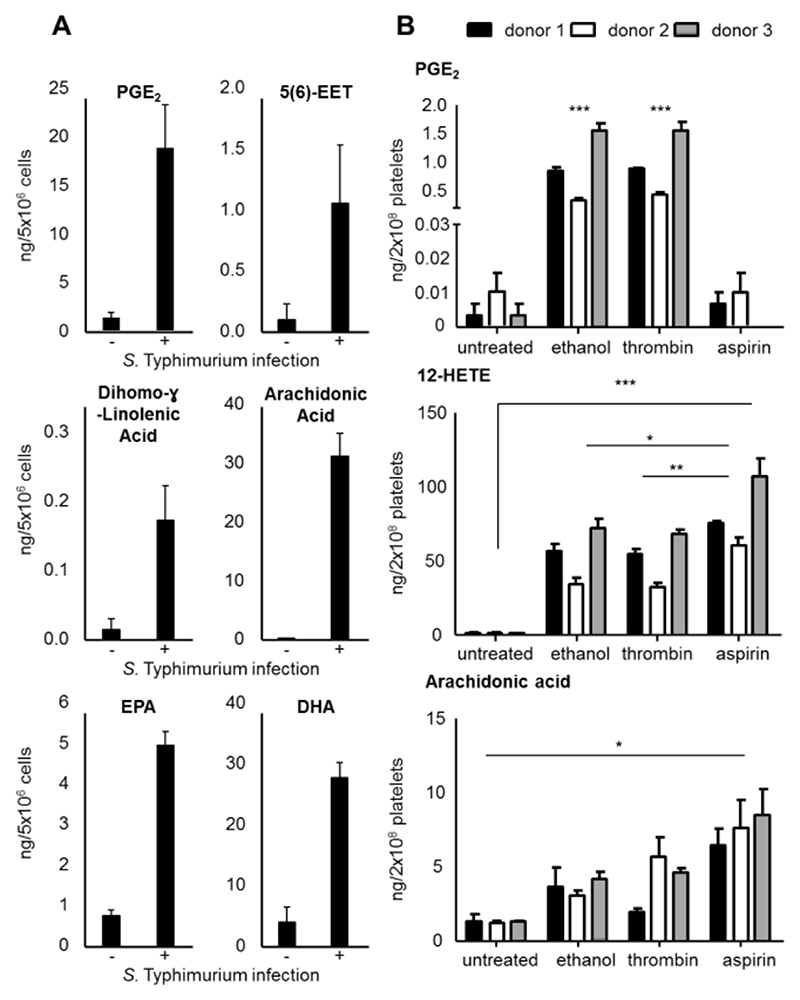
Figure 4. Quantification of oxylipins and fatty acids in S. Typhimurium infected murine BMDMs and thrombin activated human platelets analyzed by UHPLC/DTIM-MS.
(A) Lipids included in the calibration curve were quantified in BMDMs, indicating an increase of most species following infection with S. Typhimurium. (B) PGE2, 12-HETE, and arachidonic acid were quantified in platelets. PGE2 levels increased following treatment with thrombin, while its formation was inhibited by treatment with aspirin. On the other hand, both 12-HETE and arachidonic acid levels significantly increased following both thrombin alone and thrombin and aspirin treatment. Bar plots are created utilizing mean values ± standard error of the mean, * p < 0.05, ** p < 0.005, *** p < 0.0005 (Student’s t-test (BMDMs) or one-way ANOVA followed by Bonferroni correction (platelets).

