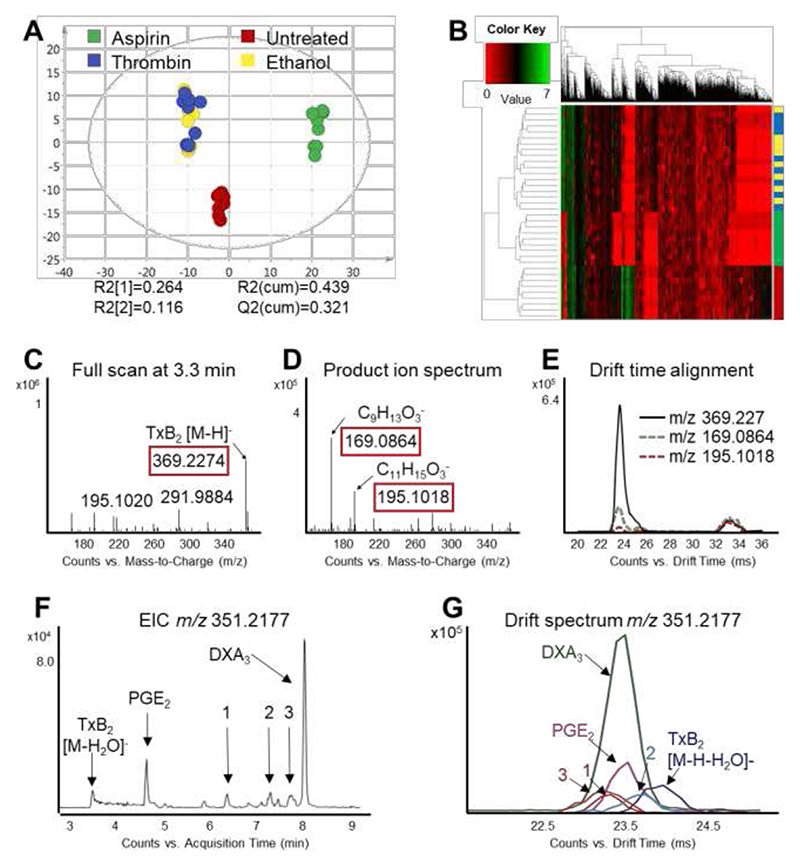
Figure 5. The changes in the oxylipin profile induced by thrombin treatment of human isolated platelets can be identified using MS/MS spectra and DT alignment of product and precursor ions.
(A) Score plot of the principal component analysis (first versus second PC) of lipid extracts of isolated human platelets analyzed by LC/DTIM-MS and processed with KniMet. The four treatment groups are: thrombin plus aspirin (green), thrombin (blue), thrombin plus ethanol (yellow) and untreated (red). (B) Heatmap representation and hierarchical clustering of the distance matrix between samples in the four treatments. Separation between treatment groups can be observed, with three distinct clusters (aspirin, control and ethanol/thrombin) in both PCA and heatmap. (C) Full scan at 3.3 min shows m/z 369.2274, which is putatively annotated as TxB2 and other oxylipins. (D) Product ion spectrum at 3.3 min shows the diagnostic product ions m/z 195.1018 and m/z 169.0864 for TxB2. (E) Precursor (black) and product ions (m/z 195.1018 dashed red; m/z 169.0864, dashed green) align in DT, confirming the identification of the feature as TxB2. Unknown species 1, 2, 3 present identical m/z, different RT (F) but very similar DT (G) of TxB2, hence they are flagged as “lipid-like” features during data annotation.

