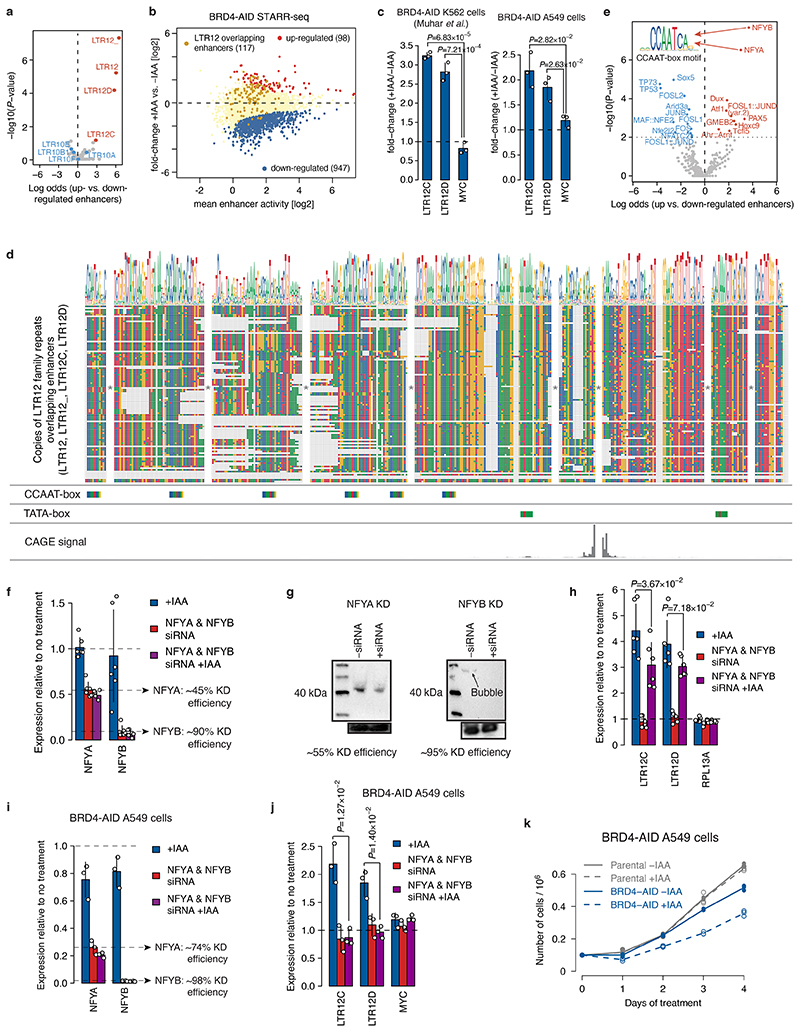
Extended Data Fig. 7. LTR12 family repeats act as BRD4 independent enhancers/promoters that contain a combination of TATA-box and multiple CCAAT-box motifs.
a, Enrichment of retrotransposons in enhancers up- vs. down-regulated upon BRD4 depletion. b, Differential analysis of enhancer activity upon BRD4 depletion with LTR12 family repeat-overlapping enhancers marked in yellow. c, Fold-change of endogenous LTR12 expression as measured by qPCR in auxin treated vs. untreated BRD4-AID K562 (left) and A549 (right) cells. In both cell lines BRD4 depletion leads to upregulation of LTR12C and D. d, Multiple alignment of LTR12 family repeats with detected enhancer activity in STARR-seq. Occurrences of CCAAT-box and TATA-box motifs, and the endogenous transcription initiation previously mapped by CAGE are marked below the alignment. e, Enrichment analysis of 579 non-redundant TF motifs from the JASPAR vertebrate core collection (https://jaspar2020.genereg.net/download/data/2020/CORE/JASPAR2020_CORE_non-redundant_pfms_jaspar.zip) between upregulated and down-regulated enhancers upon BRD4 depletion in HCT116 cells. Significantly enriched and depleted motifs (two-sided Fisher’s exact test; P-value ≤0.05) are shown in red and blue, respectively. Logo of the most highly enriched CCAAT-box motif bound by NFYA/B is shown. f, Endogenous expression of NFYA and NFYB as measured by qPCR without or with NFYA & NFYB siRNA treatment in BRD4-AID HCT116 cells. g, Western blots of NFYA (left) and NFYB (right) with and without treatment with the respective siRNA. gel source data: Supplementary Figure 1. h, Endogenous expression of LTR12C and D as measured by qPCR in auxin or/and NFYA & NFYB siRNA treated BRD4-AID HCT116 cells. i, Endogenous expression of NFYA and NFYB as measured by qPCR without or with NFYA & NFYB siRNA treatment in BRD4-AID A549 cells. j, Endogenous expression of LTR12C and D as measured by qPCR in auxin or/and NFYA & NFYB siRNA treated BRD4-AID A549 cells. k, Growth curves over a course of 4 days comparing untreated (solid line) and auxin treated (dashed line) BRD4-AID and Parental A549 cells. N=3 independent replicates. In c, f, h, i and j, mean +/- SD shown; P-values: two-sided Student’s t-test. N=3 (c, i and j) or N=6 (f and h) independent replicates; fold-change for each replicate calculated independently by dividing the treatment value with the corresponding control value.

