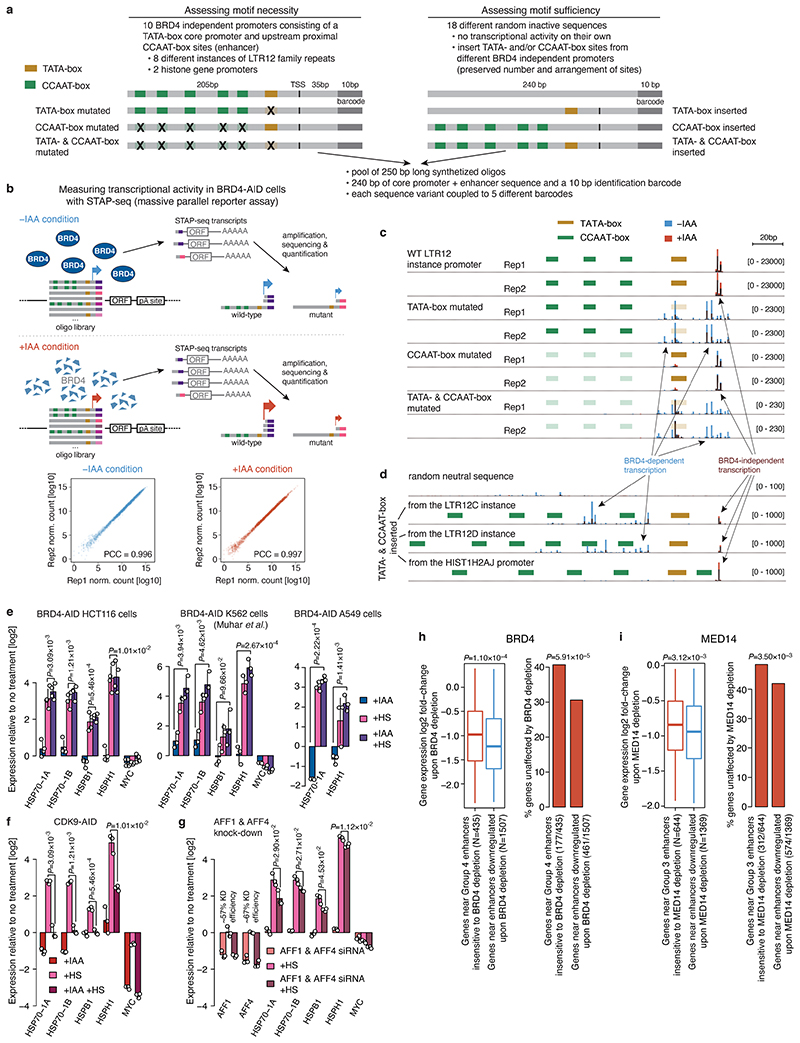
Extended Data Fig. 9. Combination of a TATA-box core promoter and CCAAT-box-containing proximal enhancer is required and sufficient to drive high levels of BRD4 independent transcription.
a, Design of a sequence library to assess the requirement and sufficiency of the TATA-box and CCAAT-box motifs in the core and proximal promoter region, respectively, for the BRD4-independent transcriptional activity with massive parallel reporter assay. For the loss of function approach (left) 10 different BRD4-independent promoters (from LTR12 repeats and histone genes) were selected and variants with either TATA- and/or CCAAT-box motifs mutated were designed. For the gain of function approach (right) the TATA- and/or CCAAT-box motifs from the 10 selected promoters were inserted into 18 randomly picked neutral sequences. Each sequence variant is present in the library 5 times, coupled to a different 10bp long barcode at the 3’ end. b, Schematic of the massive parallel reporter assay (STAP-seq) to measure transcriptional activity at a single base-pair resolution in BRD4-AID cells without or with auxin (IAA) treatment. 5’ ends of transcripts arising from each sequence present in the library are captured, amplified and sequenced, and the sequenced tags are uniquely mapped to the sequence variant of origin via the 10bp identification barcode. Correlation between transcriptional activity across all sequences in the library measured in two independent replicates for auxin treated (right) and untreated (left) cells is shown at the bottom. c, Transcriptional activity at single base-pair resolution measured by STAP-seq for wild-type (WT) and different mutant versions of the LTR12 promoter instance. Transcription from each sequence variant was assessed 5 times in the library (coupled to 5 different barcodes) and the mean normalized STAP-seq signal across different barcodes is shown for the 2 independent replicates. STAP-seq signal in auxin treated (red) vs. untreated (blue) BRD4-AID cells is shown as semi-transparent overlay. d, Transcriptional activity at single base-pair resolution measured by STAP-seq for a random neutral sequence upon insertion of TATA- and CCAAT-box motifs from an LTR12C, an LTR12D instance or from the HIST1H2AJ promoter. e-f, Endogenous expression of known heat-shock responsive genes as measured by qPCR in auxin or/and heat-shock treated BRD4-AID HCT116 (left), K549 (middle) and A549 (right) cells (e), and CDK9-AID HCT116 cells (f). In all three BRD4-AID cell lines heat-shock genes are equally strongly induced with BRD4 present or depleted but fail to get induced with CDK9 depleted. g, Endogenous expression of AFF1, AFF4 and known heat-shock responsive genes as measured by qPCR without or with AFF1 & AFF4 siRNA treatment in HCT116 cells. The induction of heat-shock genes is decreased after AFF1 & AFF4 knock-down. In e-g, N=3 independent replicates; fold-change for each replicate calculated independently by dividing the treatment value with the corresponding control value; mean +/- SD shown; P-values: two-sided Student’s t-test. h, i, Changes in gene expression (log2 fold-change in PRO-seq signal) upon BRD4 (h) or MED14 (i) depletion for two groups of genes: (1) genes that have an enhancer insensitive to respective COF depletion (Group 4 enhancer for BRD4 or Group 3 enhancer for MED14) and (2) genes that have an enhancer downregulated upon respective COF depletion within 50 kb of their TSS. Number of genes in each group (N) is denoted in parentheses. Boxes: median and interquartile range; whiskers: 5th and 95th percentiles; P-values: one-sided Wilcoxon rank-sum test. Barplots show percentage of genes in each group that are unaffected (not significantly downregulated) by COF depletion in PRO-seq. P-values: one-sided Fisher’s exact test.

