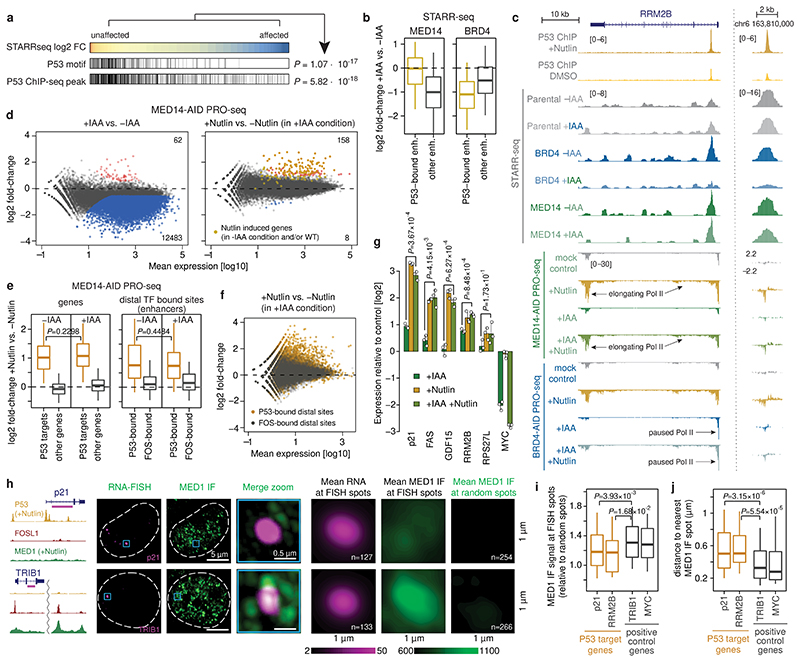
Figure 3. P53-bound enhancers and target genes are insensitive to MED14 depletion.
a, P53 motifs and ChIP-seq peaks in STARR-seq enhancers sorted from least to most affected upon MED14 depletion. P-values: one-sided Fisher’s exact test (top against bottom 20%). b, Activity change for P53-bound (N=621) vs. other (N=5628) enhancers in MED14- (left) and BRD4-AID (right) cells. c, Enhancer activity (merged normalized STARR-seq replicates) and nascent transcription (merged normalized PRO-seq replicates) in RRM2B locus upon P53 induction with Nutlin-3a in MED14- and BRD4-AID cells with and without auxin (IAA). d, Differential gene PRO-seq in MED14-AID cells (left: +/- auxin; right: auxin+Nutlin-3a vs. auxin-only; FDR≤0.05; fold-change≥2; N=2 independent replicates; yellow: 151 Nutlin-3a-induced genes [Extended Data Fig. 4b]). PRO-seq fold-change for P53 targets (left; N=243 [Extended Data Fig. 4c]) and distal P53-bound sites around targets (right) in MED14-AID cells upon Nutlin-3a with (+IAA) or without auxin (-IAA). N = 243, 20964, 233, 346 for P53 targets, other genes, P53- and FOS-bound enhancers, respectively. f, Differential PRO-seq analysis for distal P53- or FOS-bound enhancers upon Nutlin-3a in auxin-treated MED14-AID cells. g, Expression (qPCR) of P53 targets in auxin- or/and Nutlin-3a-treated MED14-AID cells. N=3 independent replicates; mean +/- SD; P-values: two-sided Student’s t-test. h, MED1 IF with concurrent RNA-FISH against P53 target p21 (top) and control TRIB1 gene (bottom) in Nutlin-3a-treated HCT116 cells. Left: gene loci with P53, FOSL1 and MED1 ChIP-seq signal and intronic FISH target sequence (magenta). Dashed line: nuclear periphery. Right: mean RNA-FISH and MED1-IF signals centred on FISH spots, or random spots (n=number of spots). i, MED1 IF signal at FISH spots, normalized to mean MED1 IF signal at random regions. j, Distance between FISH spot and nearest MED1 IF spot. In i and j, N = 127, 50, 133, 118 FISH spots for p21, RRM2B, TRIB1 and MYC, respectively. In b, e, i and j, boxes: median and interquartile range; whiskers: 5th and 95th percentiles; P-values: two-sided Wilcoxon rank-sum test.

