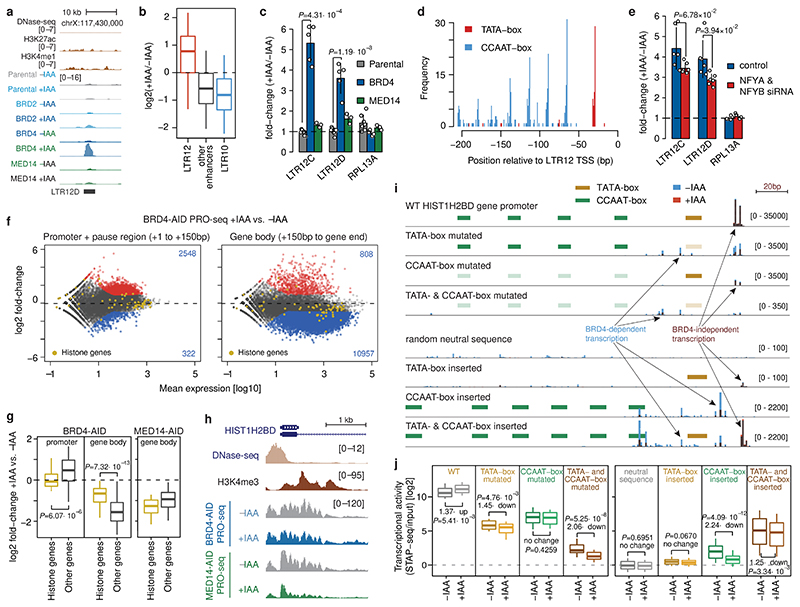
Figure 4. Combination of TATA- and CCAAT-boxes renders transcription of LTR12 retrotransposons and histone genes independent of BRD4.
a, LTR12D element with increased enhancer activity upon BRD4 degradation. b, Enhancer-activity change upon BRD4 depletion for LTR12- (N=117), LTR10-overlapping (N=198) and all other (N=5935) enhancers. c, Change in endogenous LTR12 expression (qPCR) upon auxin treatment of BRD4- or MED14-AID cells. N = 7, 5, 3 independent replicates for Parental, BRD4- and MED14-AID cells, respectively. d, Occurrence of TATA- and CCAAT-boxes in LTR12 repeats with STARR-seq activity, relative to their endogenous TSSs. e, Change in endogenous LTR12 expression (qPCR) upon BRD4 depletion before and after NFYA & NFYB knock-down. N=6 independent replicates. f, Differential analysis (+/-auxin) of PRO-seq in promoter+pause region (left) and gene body (right) for BRD4-AID cells (FDR≤0.05; fold-change≥2; yellow: histone genes; N=2 independent replicates). g, Change of PRO-seq signal in promoter+pause region and gene body in BRD4-AID cells (left) and gene body in MED14-AID cells (right) for histone genes (N=50) vs. all other expressed genes (N=11869). h, PRO-seq signal at HIST1H2BD in BRD4- and MED14-AID cells +/-auxin (normalized signal for merged replicates). i, Transcription (base-pair resolution; Extended Data Fig. 9b) from WT and mutant HIST1H2BD promoters (top) and from neutral sequences with inserted LTR12-derived TATA- and/or CCAAT-boxes (bottom). Mean normalized STAP-seq signal across barcodes and replicates (N=2 independent replicates, 5 barcodes per sequence) in +auxin (red) vs. -auxin (blue) BRD4-AID cells is overlaid. j, STAP-seq signal for WT and mutated versions of histone and LTR12 promoters (left; N=50), and for random neutral sequences with inserted TATA- and/or CCAAT-boxes (right; N = 90, 120, 900 for WT, single insertions and double insertions, respectively). In b, g, j, boxes: median and interquartile range; whiskers: 5th and 95th percentiles; P-values: two-sided Wilcoxon rank-sum test. In c, e, mean +/- SD; P-values: two-sided Student’s t-test.

