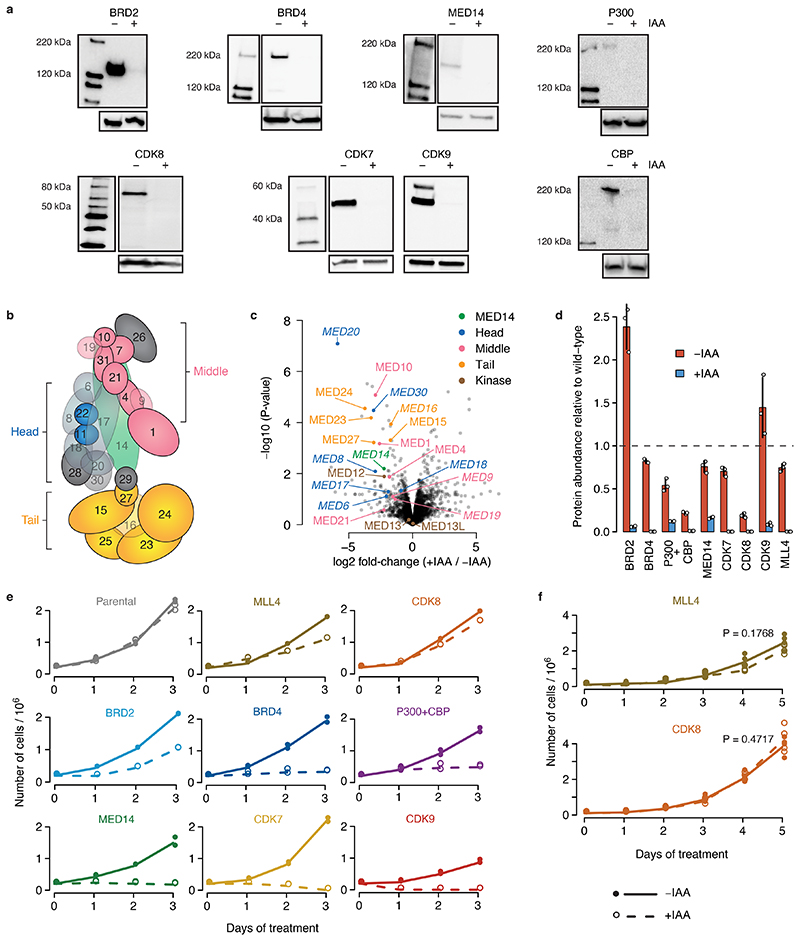
Extended Data Fig. 1. Validation of cofactor degradation and effect on cell growth.
a, Western blots of denoted cofactors (COF) in the cell line where the respective COF is tagged by AID, without and with auxin (IAA) treatment for 1h. done once; validated by mass spectrometry; gel source data: Supplementary Figure 1. b, Schematic of the Mediator complex structure with head, middle and tail domains shown in different colors. Core structural subunit MED14 targeted in this study is shown in green. Subunits that cannot be detected anymore in mass-spectrometry upon MED14 depletion are semi-transparent. c, Protein abundance change as measured by shot-gun mass-spectrometry upon MED14 depletion by auxin treatment. All detected Mediator subunits are marked and colored according to different Mediator modules/domains shown in b. Subunits marked in italic were not detected anymore (i.e. were below detection limit) in all replicates of auxin treatment. N=3 independent replicates. d, Protein abundance of denoted COFs as measured by targeted mass-spectrometry approach in the cell line where the respective COF is tagged by AID, without and with auxin treatment for 3h. N=3 independent replicates; mean +/- SD shown. e, Growth curves over a course of 3 days comparing untreated (solid line) and auxin treated (dashed line) cells, for each COF-AID cell line. N=2 independent replicates. f, Growth curves over a course of 5 days comparing untreated (solid line) and auxin treated (dashed line) cells for MLL4- and CDK8-AID cell line. N=3 independent replicates. P-value of two-sided Student’s t-test at final day 5 timepoint is shown.

