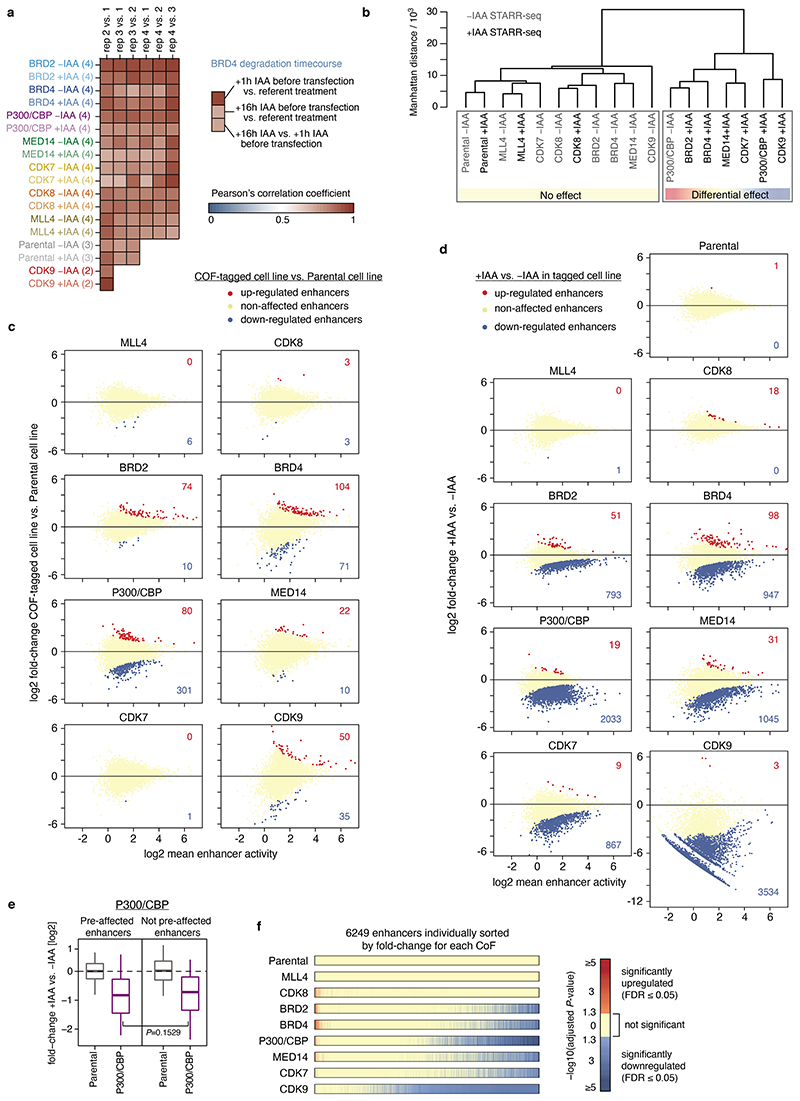
Extended Data Fig. 2. Effect of cofactor tagging and targeted cofactor degradation on enhancer activity.
a, Pearson’s correlations for pair-wise comparisons of replicates for each cofactor (COF) with and without auxin (IAA) treatment calculated across a reference set of 6249 enhancers. For majority of COFs there are 4 independent replicates in each condition, except for our positive and negative controls, CDK9 and the Parental cell line, that have 2 and 3 replicates per condition, respectively. Inset on the right shows correlations between BRD4 samples pre-treated with auxin before STARR-seq library transfection, i.e. with an extended period of protein degradation. b, Hierarchical clustering of untreated and auxin treated Parental and different COF-AID cell lines based on enhancer activity for a reference set of 6249 enhancers. All untreated cell lines (except p300/CBP which shows high level of COF pre-degradation in absence of auxin) cluster together with the Parental cell line, as well as auxin treated MLL4- and CDK8-AID cell lines. c, Differential analysis of STARR-seq enhancer activity between each individual COF-AID cell line and Parental cell line without any treatment to assess the effect of COF-tagging on enhancer activity. Number of significantly up- or down-regulated enhancers is denoted (FDR≤0.05). d, Differential analysis of STARR-seq enhancer activity for each COF-AID cell line with and without auxin treatment to assess the effect of COF degradation on enhancer activity. Number of significantly up- or down-regulated enhancers is denoted (FDR≤0.05). e, Log2 fold-change in enhancer activity for enhancers pre-affected by P300 and CBP tagging (left; N=301) and the rest of non-affected enhancers (right; N=5948) in Parental and P300/CBP-AID cells upon auxin treatment. Boxes: median and interquartile range; whiskers: 5th and 95th percentiles. P-values: two-sided Wilcoxon rank-sum test. f, Significance of change in enhancer activity (P-values from differential analysis corrected for multiple testing/FDR) for a reference set of 6249 enhancers sorted individually by fold-change in each COF-AID cell line, from unaffected (or upregulated) enhancers on the left to most downregulated enhancers on the right.

