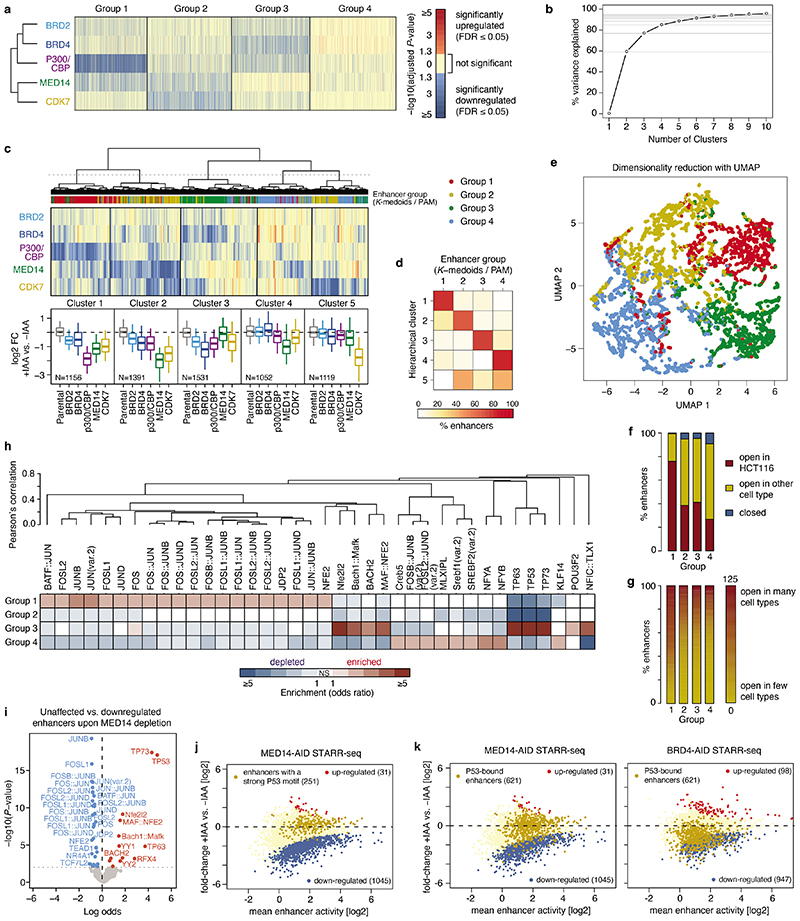
Extended Data Fig. 3. Features of the four different groups of enhancers.
a, Significance of change in enhancer activity (P-values from differential analysis corrected for multiple testing/FDR) upon individual cofactor degradation for four groups of enhancers defined by PAM (partitioning-around-medoids) clustering. Significant P-values (FDR≤0.05) for down- and up-regulated enhancers are shown in shades of blue and red, respectively. Non-significant P-values are shown in yellow. N = 1392, 1660, 1519, 1678 for Groups 1-4, respectively. b, Percent of variance explained by clustering of 6249 enhancers with partitioning around medoids (PAM) algorithm into different number of clusters. Four clusters explain ~85% of the variance. c, Hierarchical clustering of enhancers based on change in enhancer activity upon individual cofactor degradation. Boxplots summarize the log2 fold-change values per COF for each of the 5 clusters defined by cutting the dendrogram as denoted with a dashed line. Enhancer group assignment (from PAM clustering shown in Fig. 2a) is denoted by the coloured stripe below the dendrogram. N = 1156, 1391, 1531, 1052, 1119 for Groups 1-5, respectively. Boxes: median and interquartile range; whiskers: 5th and 95th percentiles. d, Agreement between clusters defined by hierarchical clustering and enhancer groups defined by PAM. For each hierarchical cluster (row) percent of enhancers falling into each PAM enhancer group is shown. e, Two-dimensional visualization of the data after dimensionality reduction with UMAP algorithm. Points represent individual enhancers coloured by their group membership (from PAM clustering). f, Percent of enhancers accessible/open according to DNase-seq in HCT116 cells or in other cell types in the four groups of enhancers defined in Fig. 2a. g, Percent of enhancers accessible/open according to DNase-seq in different number of cell lines ranging from enhancers closed in all cell lines (0 - yellow) to enhancers open in many/all (125 - red) cell lines assayed by DNase-seq in ENCODE. h, Mutual enrichment of transcription factor motifs for the four groups of enhancers. For each motif from the JASPAR vertebrate core collection of 579 non-redundant TF motifs (https://jaspar2020.genereg.net/download/data/2020/CORE/JASPAR2020_CORE_non-redundant_pfms_jaspar.zip) the enrichment/depletion in each group is assessed against the remaining three groups using two-sided Fisher’s exact test and only motifs with P-value≤0.001 and odds-ratio≥2 are shown. The motifs are hierarchically clustered based on pair-wise Pearson’s correlation between motif position-weight matrices (PWMs) to group together similar motifs. A selection of representative motifs from these groups of similar motifs is shown in Fig. 2e. i, Enrichment analysis of 579 non-redundant TF motifs from the JASPAR vertebrate core collection (https://jaspar2020.genereg.net/download/data/2020/CORE/JASPAR2020_CORE_non-redundant_pfms_jaspar.zip) between unaffected and down-regulated enhancers upon MED14 depletion. Significantly enriched and depleted motifs (two-sided Fisher’s exact test; P-value ≤0.01) are shown in red and blue, respectively. j, Differential analysis of enhancer activity upon MED14 depletion with enhancers containing a P53 motif marked in yellow. k, Differential analysis of enhancer activity upon MED14 (left) or BRD4 (right) depletion with enhancers overlapping a P53 ChIP-seq peak marked in yellow.

