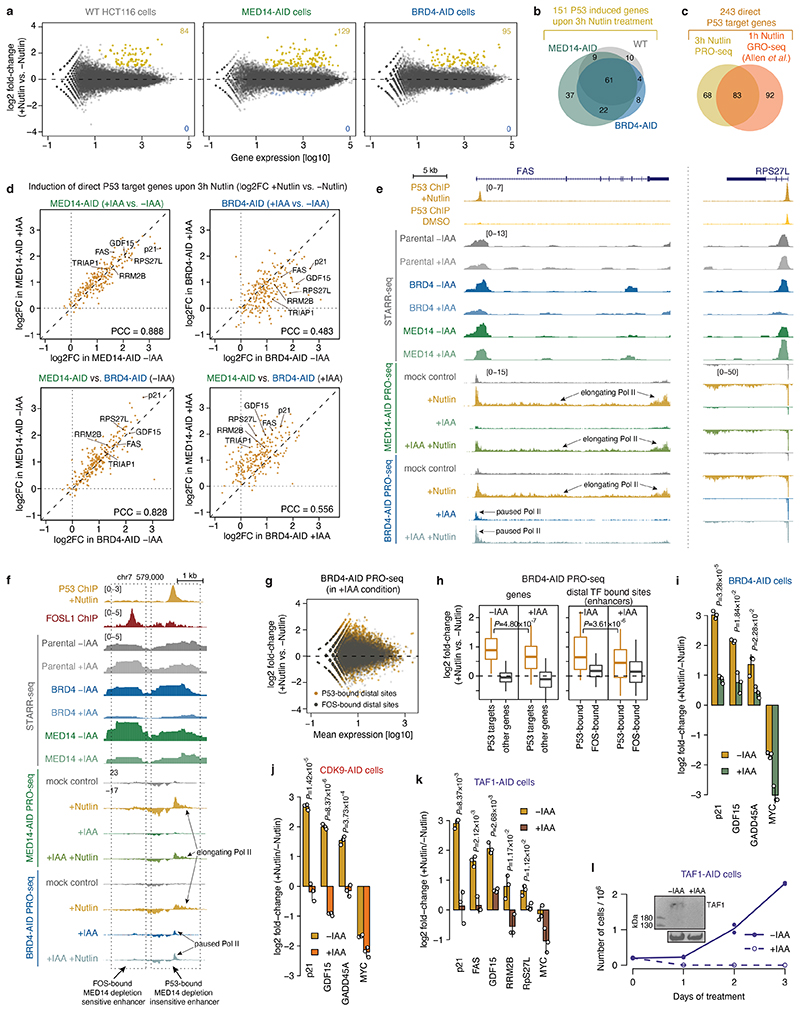
Extended Data Fig. 4. Induction of P53 target genes and enhancers is insensitive to MED14 depletion, but sensitive to BRD4 depletion.
a, Differential analysis of PRO-seq signal at genes between Nutlin-3a treated and untreated WT HCT116 (left), MED14- (middle) or BRD4-AID (right) cells. Number of significantly upregulated genes in each cell line is denoted in yellow (FDR≤0.05 and fold-change≥2). N=2 independent replicates for each condition. b, Venn diagram showing overlap of significantly upregulated genes in the 3 cell lines shown in panel a, defining in total 151 P53 target genes induced after 3h of Nutlin-3a treatment. c, Venn diagram showing overlap of 151 P53 target genes induced after 3h of Nutlin-3a (this study) and 175 P53 target genes defined previously after 1h of Nutlin-3a treatment76, defining a set of 243 direct P53 target genes used in panels d and h, and in Fig. 3e. d, Comparison of induction of direct P53 target genes (defined in panel c) in different cell lines and conditions. Top row compares induction in MED14- (left) or BRD4-AID (right) cells when the respective factor is present (-IAA) or depleted (+IAA). P53 targets are induced to the same extent upon MED14 depletion, but their induction is impeded upon BRD4 depletion. Bottom row compares induction between the two cell lines in the condition without auxin (left) or with auxin (right). Without auxin both MED14- and BRD4-AID cells induce P53 target genes to the same extent, however with auxin the induction in the BRD4-AID cells is impeded compared to the MED14-AID cells. e, Loci of the P53 target genes FAS (left) and RPS27L (right) with intronic P53-bound enhancers. Enhancer activity in different COF-AID cell lines with and without auxin (IAA) treatment is shown (normalized STARR-seq signal for merged replicates), together with nascent transcription (normalized PRO-seq signal for merged replicates) upon induction of P53 signalling with Nutlin-3a in MED14- and BRD4-AID cells with and without auxin treatment. Transcription of both genes is induced upon Nutlin treatment in both conditions with MED14 present (-IAA) or degraded (+IAA), but is strongly reduced with BRD4 degraded due to a pause-release defect that persists upon Nutlin treatment. Activity of their associated P53-bound enhancers is unchanged upon MED14 depletion but is abolished upon BRD4 depletion. f, Locus with a FOS-bound MED14-depletion sensitive (left) and a P53-bound MED14-depletion insensitive (right) enhancer. Activity in different COF-AID cell lines with and without auxin (IAA) treatment is shown (normalized STARR-seq signal for merged replicates), together with nascent transcription (normalized PRO-seq signal for merged replicates) upon induction of P53 signalling with Nutlin-3a in MED14- and BRD4-AID cells with and without auxin treatment. Activity of the FOS-bound enhancer is strongly reduced by both MED14 and BRD4 depletion, whereas the activity of the P53-bound enhancer is unchanged upon MED14 depletion but is abolished upon BRD4 depletion. Endogenous bidirectional transcription of the P53-bound enhancer is induced upon Nutlin treatment in both conditions with MED14 present (-IAA) or degraded (+IAA), but is reduced with BRD4 degraded due to a pause-release defect that persists upon Nutlin treatment. g, Differential analysis of PRO-seq signal at distal P53 or FOS bound sites (enhancers) upon Nutlin-3a treatment in auxin treated BRD4-AID cell line. h, Log2 fold-change of PRO-seq signal for direct P53 target genes (left; genes defined in panel c) and distal P53 bound sites around direct P53 target genes (enhancers; right) in BRD4-AID cell line upon Nutlin-3a induction in background with BRD4 present (-IAA) or depleted (+IAA). N = 151, 20964, 244, 359 for P53 targets, other genes, P53- and FOS-bound enhancers, respectively. Boxes: median and interquartile range; whiskers: 5th and 95th percentiles; P-values: two-sided Wilcoxon rank-sum test. i-k, Endogenous induction of known P53 target genes with Nutlin-3a as measured by qPCR in BRD4- (i), CDK9- (j) or TAF1-AID (k) cells without or with auxin treatment, i.e. with the respective factor present or degraded. N=3 independent replicates; fold-change for each replicate calculated independently by dividing the treatment value with the corresponding control value; mean +/- SD shown; P-values: two-sided Student’s t-test. l, Growth curves over a course of 3 days comparing untreated (solid line) and auxin treated (dashed line) TAF1-AID cells. N=2 independent replicates. Inset shows Western blot for TAF1 in cells without and with auxin (IAA) treatment for 1h. gel source data: Supplementary Figure 1.

