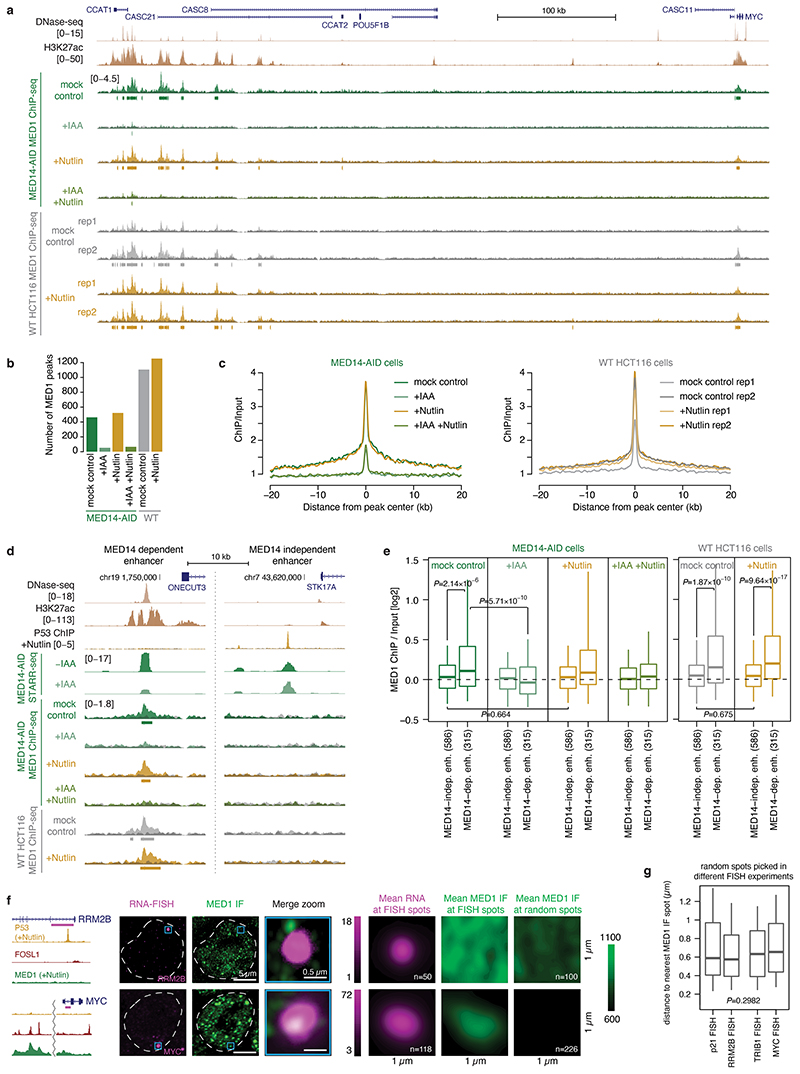
Extended Data Fig. 5. P53 target genes and enhancers are not bound by MED1.
a, Locus of the MYC gene with an upstream cluster of endogenously active MED1-bound enhancers. ChIP-seq signal and called MED1 peaks in MED14-AID cells treated with auxin or/and Nutlin-3a and in WT HCT116 cells treated with Nutlin-3a are shown. b, Number of MED1 peaks called in each condition in MED14-AID and WT cells (MACS2, FDR≤0.05). c, Average plot of MED1 ChIP-seq enrichment over input for a common set of MED1 peaks called in MED14-AID (638 peaks; left) and in WT HCT116 cells (1545 peaks; right). d, Example of an endogenously active MED14-dependent enhancer bound by MED1 (left) and a P53-bound MED14-independent enhancer not bound by MED1 (right). MED14-dependent enhancer is bound by MED1 in both WT and MED14-AID cells and this binding is abolished upon auxin treatment, i.e. upon MED14 depletion. P53-bound enhancer shows no MED1 binding in any condition, not even upon P53 induction with Nutlin-3a in either WT or MED14-AID cells. e, MED1 ChIP-seq enrichment over input for 2 groups of STARR-seq enhancers: 1) MED14-independent, P53-bound enhancers (N=586) and 2) endogenously open and H3K27ac-marked MED14-dependent enhancers (N=315), upon Nutlin-3a treatment in control and MED14-depleted MED14-AID cells (left) or in WT cells (right). While MED14-dependent enhancers show some MED1 binding in both WT and MED14-AID cells, which is abolished upon MED14 depletion (i.e. auxin treatment), P53-bound enhancers show no binding in any condition, including after Nutlin-3a treatment when these enhancers are activated. Boxes: median and interquartile range; whiskers: 5th and 95th percentiles. P-values: two-sided Wilcoxon rank-sum test. f, MED1 IF with concurrent RNA FISH against P53 target gene RRM2B (top row) and Mediator-regulated positive control gene MYC (bottom row) in Nutlin-3a treated WT HCT116 cells. Examples of individual cells with merged view of the FISH and MED1 IF signal at the FISH spot are shown on the left. Hoechst staining was used to determine the nuclear periphery, highlighted with a dashed white line. Mean RNA FISH and mean MED1 IF signal in 1x1μm window centred at FISH spots, or at random spots is shown on the right. Number of spots analysed is indicated in the lower right corner (n). g, Distribution of distance between each random spot and the nearest MED1 IF spot for random spots picked in different FISH experiments. Boxes: median and interquartile range; whiskers: 5th and 95th percentiles. P-value: Kruskal-Wallis rank sum test.

