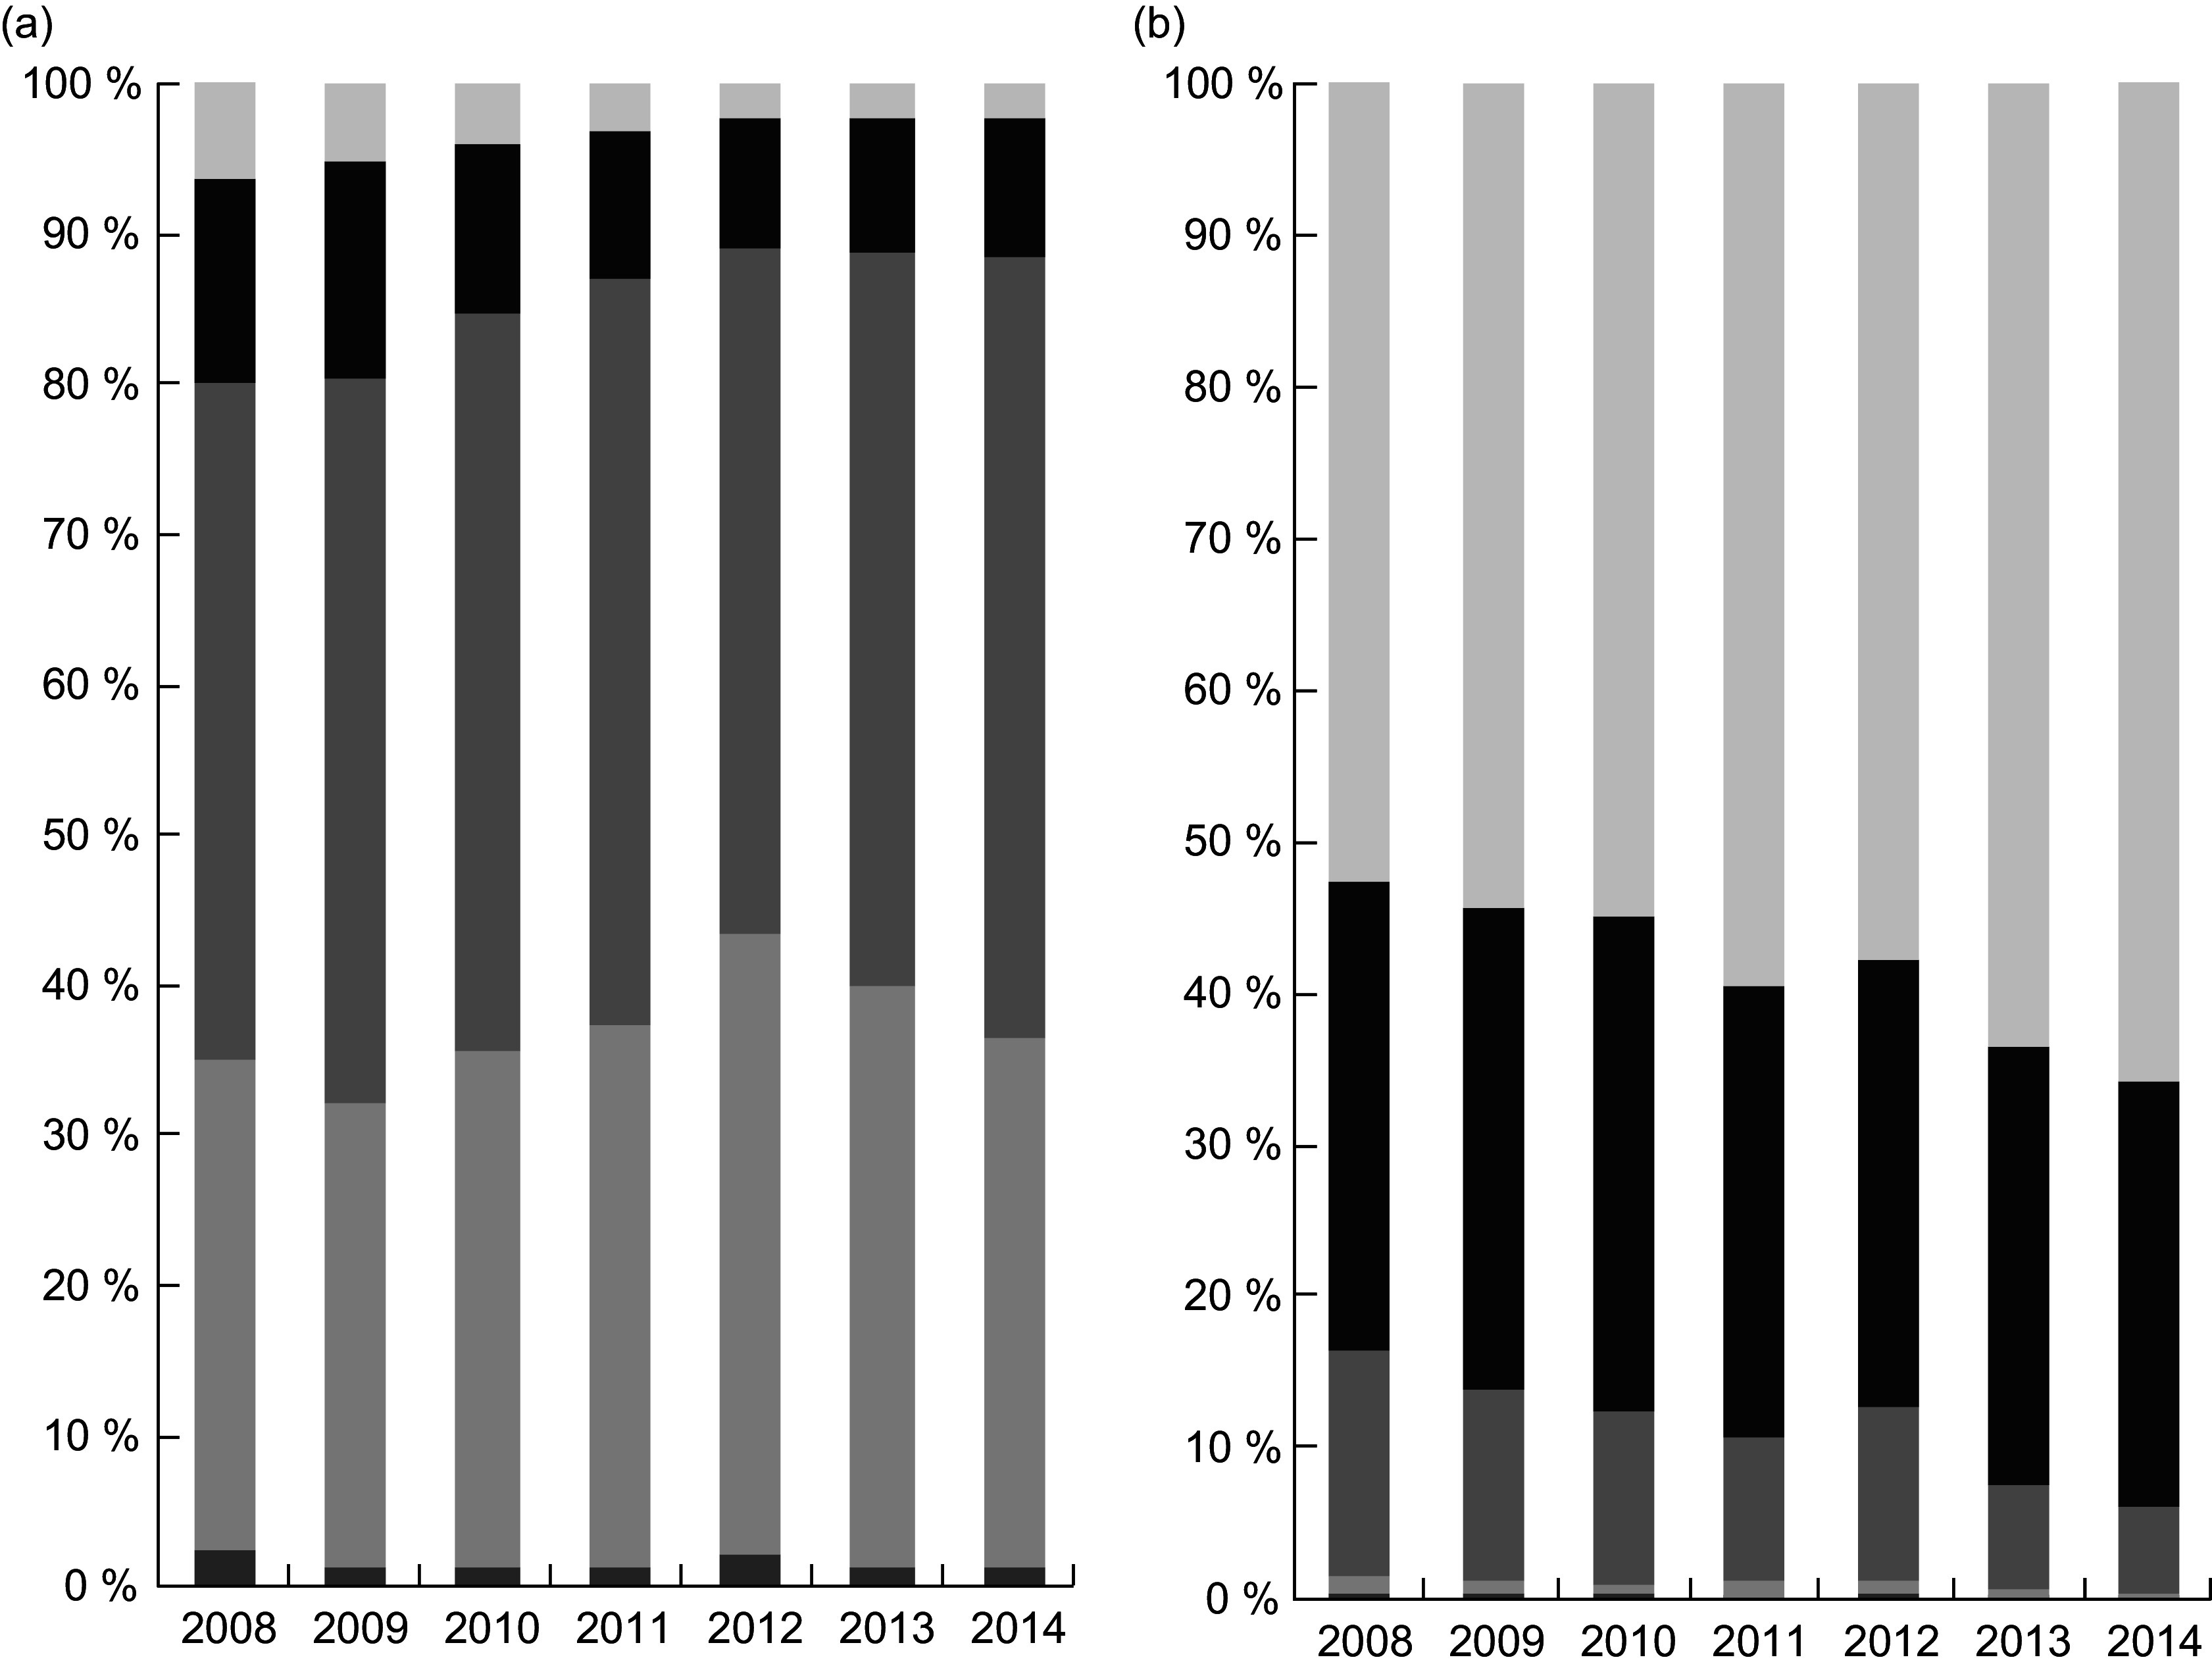
Fig. 1.

Frequency of municipalities according to the prevalence thresholds# for stunting (a) and overweight (b) in children enrolled in the Bolsa Família Program, Brazil, 2008–2014 (n 4443). #WHO–UNICEF Technical Expert Advisory Group on Nutrition Monitoring(25). Stunting (a)  , Very low (< 25 %);
  , low (2·5–9·9 %);
  , medium (10–19·9 %);
  , high (20–29·9 %);
  , very high (≥ 30 %). Overweight (b)
 , Very low (< 2·5 %);
  , low (2·5–4·9 %);
  , medium (5–9·9 %);
  , high (10–14·9 %);
  , very high (≥ 15 %)
