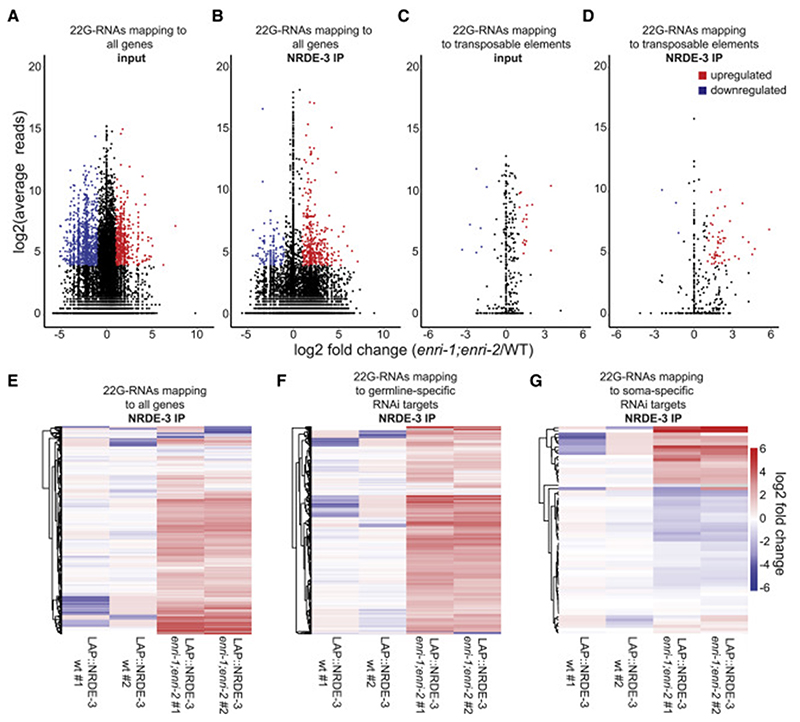
Figure 5. Loss of the enri genes leads to deregulation of NRDE-3-associated small RNAs.
(A) (B) MA plot (where M is the difference between log intensities and A is the average log intensity for a dot in the plot) of (A) input or (B) FLAG-IP 22G-RNA reads mapping antisense to individual genes from LAP::NRDE-3 (enri-1(tag1609);enri-2(tag1609)) embryos compared to 22G-RNA reads from LAP::NRDE-3 (WT). (C) (D) MA plot of (C) input or (D) FLAG-IP 22G-RNA reads mapping antisense to annotated transposable elements from LAP::NRDE-3 (enri-1;enri-2) embryos compared to 22G-RNA reads from LAP::NRDE-3 (WT). Shown in red are significantly upregulated 22G-RNAs and shown in blue are significantly downregulated 22G-RNAs. Only 22G-RNAs that displayed log2(fold-change) > 1, log2(average reads) > 4 and padj < 0.05 were considered significantly changed from wild-type. (E) Heat map of all 22G-RNAs mapping to individual genes recovered in LAP::NRDE-3 IPs. (F) Heat map of 22G-RNAs mapping to all annotated germline-specific RNAi targets recovered in LAP::NRDE-3 IPs. (G) Heat map of 22G-RNAs mapping to all annotated soma-specific RNAi targets recovered in LAP::NRDE-3 IPs. See also Figures S4, S5, and S6.

