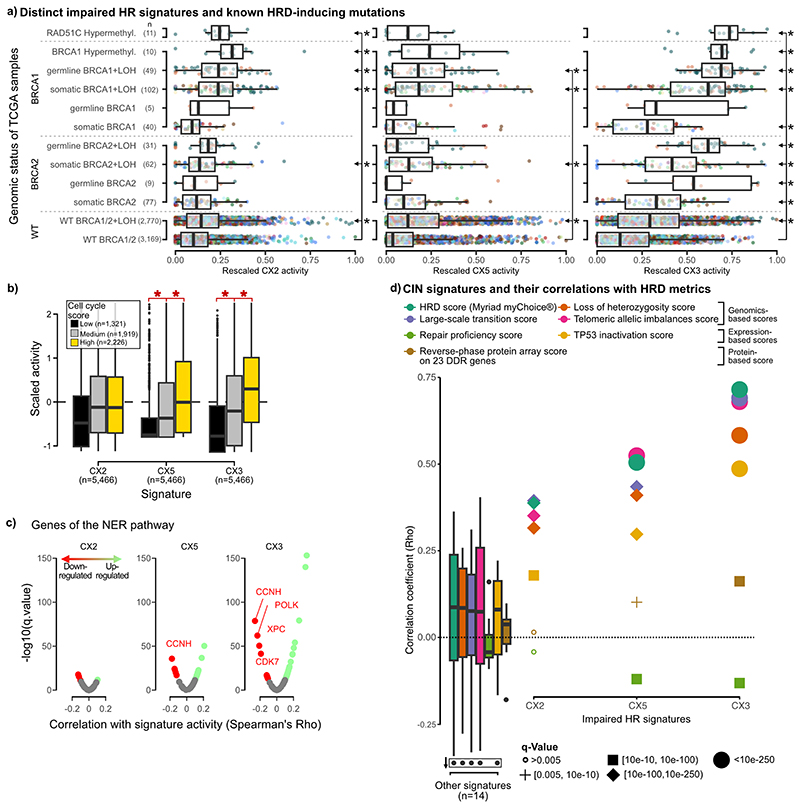
Extended Data Fig. 9. Impaired homologous recombination signatures and their associations.
a: Boxplots summarise signature activities of different patient groups (rows) defined by their driver gene mutation status. Ovarian samples are coloured in dark green and breast in orange. Boxes represent the interquartile range (IQR) with the median as a bolded line. The whiskers extend to the largest/smallest value no further than 1.5 * IQR from the hinge. Outliers beyond the end of the whiskers are marked individually as points. Significance tested with two-sided Welch’s t-test between WT BRCA1/2 and each of the categories and corrected for multiple testing by using Benjamini-Hochberg method. Statistically significant comparisons are shown to the right of the boxplots with stars denoting significance (q<0.05) and arrows denoting the two groups used for the statistical test. (BRCA1/2 = BRCA1 and BRCA2, WT = wild type; LOH = loss of heterozygosity) b: Boxplots (with same characteristics as in a) summarise the scaled signature activities of 5,466 TCGA samples split by low, medium and high cell cycle scores. The brackets and stars (q<0.05) show where there was a significant increase from low to medium to high cell cycle groups tested with a Welch’s t-test and corrected for multiple testing with Benjamini-Hochberg method. c: Volcano plots showing the results of a correlation between signature activity and expression of genes involved in nucleotide excision repair (NER). Each dot represents a gene, coloured dots show significant correlations. d: Spearman correlation coefficient (y-axis) of correlation between signature activities and seven common metrics of HRD (listed at top). Individual coefficients are displayed for impaired homologous recombination (IHR) signatures and the distribution of coefficients from remaining signatures are represented by boxplots (with same characteristics as in a).

