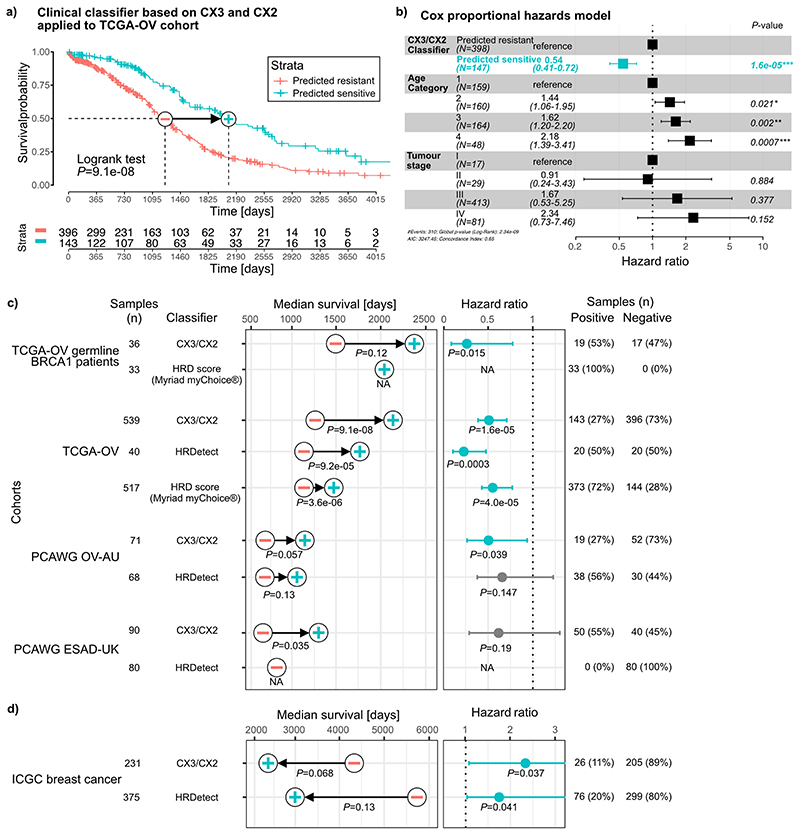
Extended Data Fig. 10. Performance of classifiers for predicting platinum sensitivity.
a: Kaplan-Meier estimator showing the overall survival probabilities of TCGA ovarian cancer patients split into two groups using our CX3/CX2 classifier. b: Hazard ratios and their 95% confidence interval obtained from a Cox proportional hazards model trained on our CX3/CX2 classification predicting overall survival of TCGA ovarian cancer patients. The model also corrected for age and cancer stage of the patients. P-value represents the significance of a Wald test. c+d: Median survival and hazard ratios generated for five cancer cohorts from the TCGA, PCAWG and ICGC projects using predictions from three classifiers (our CX3/CX2 classifier, HRDetect and Myriad myChoice based on the HRD score). Improvements in median survival tested by log-rank test (Kaplan-Meier survival analysis), with the minus symbol representing the predicted resistant group and the plus symbol the predicted sensitive group. Hazard ratios, their 95% confidence interval, and Wald test significance of the predicted sensitive group compared to the predicted resistant group are obtained from Cox proportional hazards models correcting for stage and age of patients, except for HRDetect where tumour stage was omitted as the models did not converge if included. The number and proportion of patients predicted to be sensitive (with HRD) and resistant (without HRD) by each classifier are listed on the right.

