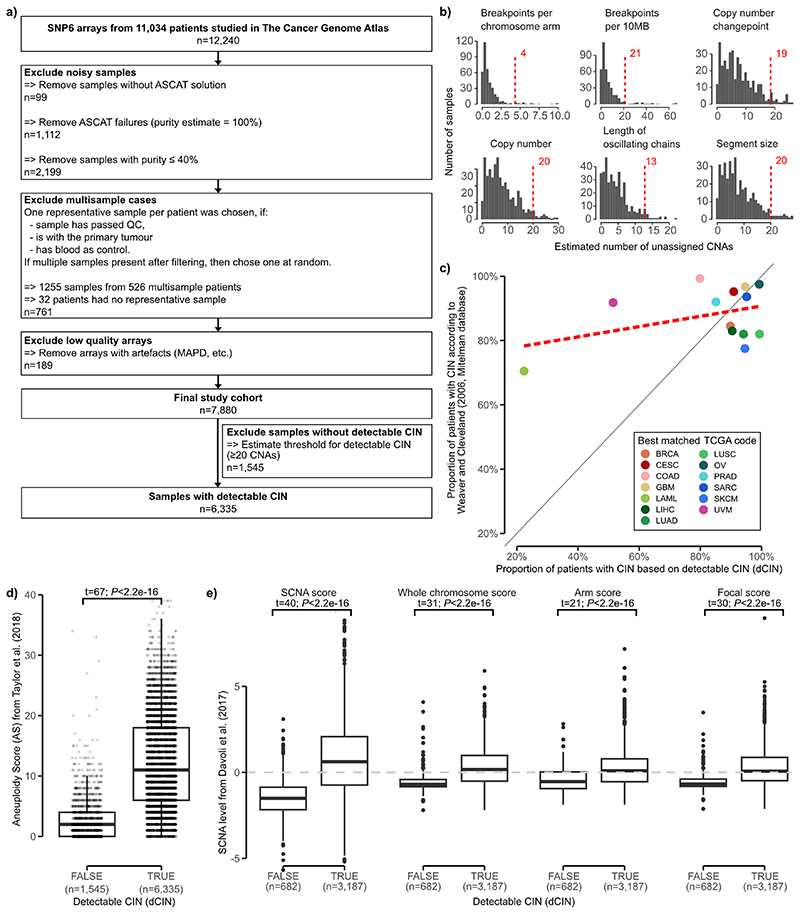
Extended Data Fig. 1. Workflow of sample filtering and detectable chromosomal instability (dCIN).
a: REMARK diagram showing flow of samples through the study. b: For each copy number feature of the previous ovarian signatures: a histogram of number of events per sample that could not be assigned to an ovarian copy number signature on the TCGA ovarian cohort. Red dotted line indicates the quantile 0.95. c: Scatterplot of cancer types comparing our estimate of detectable CIN (Supplementary Methods) to estimates reported in the Mitelman database. d+e: Boxplots comparing our estimate of detectable CIN with aneuploidy score and four CNA-specific metrics. Boxes represent the interquartile range (IQR) with the median as a bolded line. The whiskers extend to the largest/smallest value no further than 1.5 * IQR from the hinge. Outliers beyond the end of the whiskers are marked individually as points. Results of two-sided Welch’s t-test shown on top of the boxplots.

