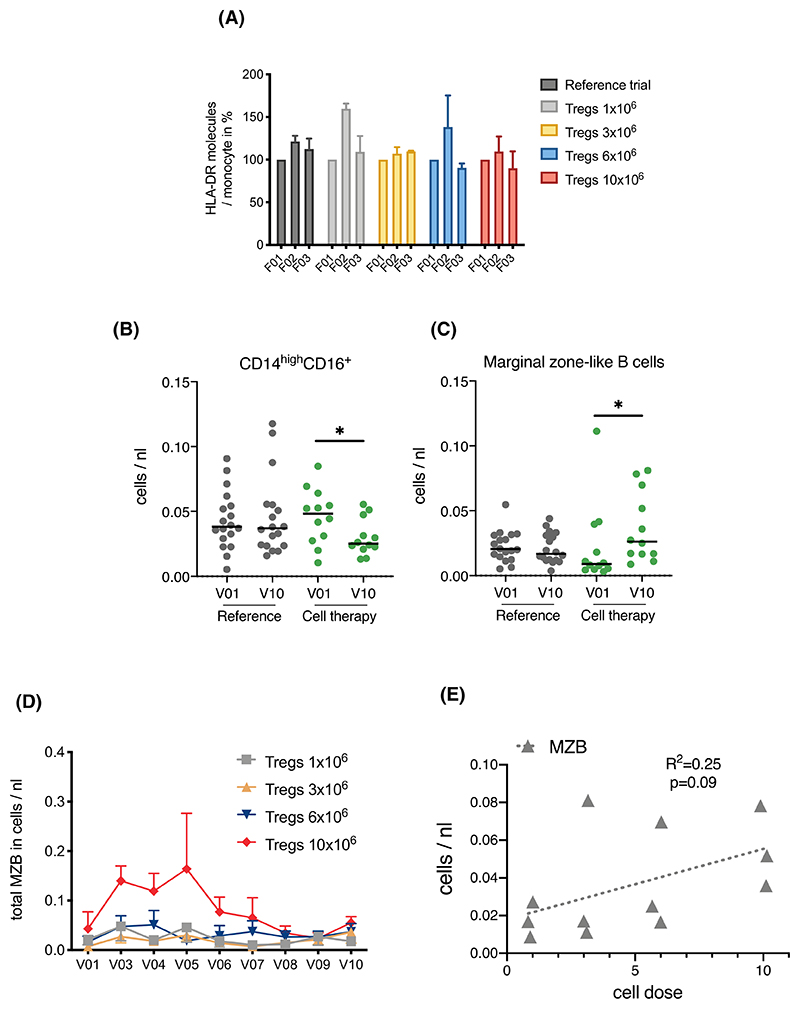
Figure 6. Effect of Treg therapy on immune cell composition.
(A) Treg infusion of either 1 × 10⁶, 3 × 10⁶, 6 × 10⁶, and 10 × 106 cells/kg. (n = 3 patients/dose) did not lead to a significant increase in HLA-DR expression on CD14+ monocytes 1 day (F02) or 7 days later (F03). (B,C) Differences in posttransplant changes in CD14highCD16+ monocytes and marginal zone-like B cells. Scatter plots of absolute numbers in whole blood samples collected pretransplant (V01) and at the end of the observation period (60 weeks posttransplant, V10) from reference (n = 19) and cell therapy trial patients (n = 12). Statistical analysis by Wilcoxon matched-pairs signed rank and Dunn's multiple comparison test. *p < .05. (D) Trend toward dose-dependent increase in absolute numbers of marginal zone-like B cells upon Treg infusion 2 weeks after transplantation determined by whole blood flow cytometry in samples collected from patients receiving either 1 × 10⁶, 3 × 10⁶, 6 × 10⁶, or 10 × 106 cells/kg. (n = 3 patients per dose) prior to transplantation (V01), at 2 (V03), 4 (V04), 8 (V05), 12 (V06), 24 (V07), 36 (V08), 48 (V09), and 60 (V10) weeks posttransplant. (E) Trend toward dose-dependent increase in absolute numbers of marginal zone-like B cells at the end of the observation period (60 weeks posttransplant, V10). Statistical analysis by linear regression [Color figure can be viewed at wileyonlinelibrary.com]

