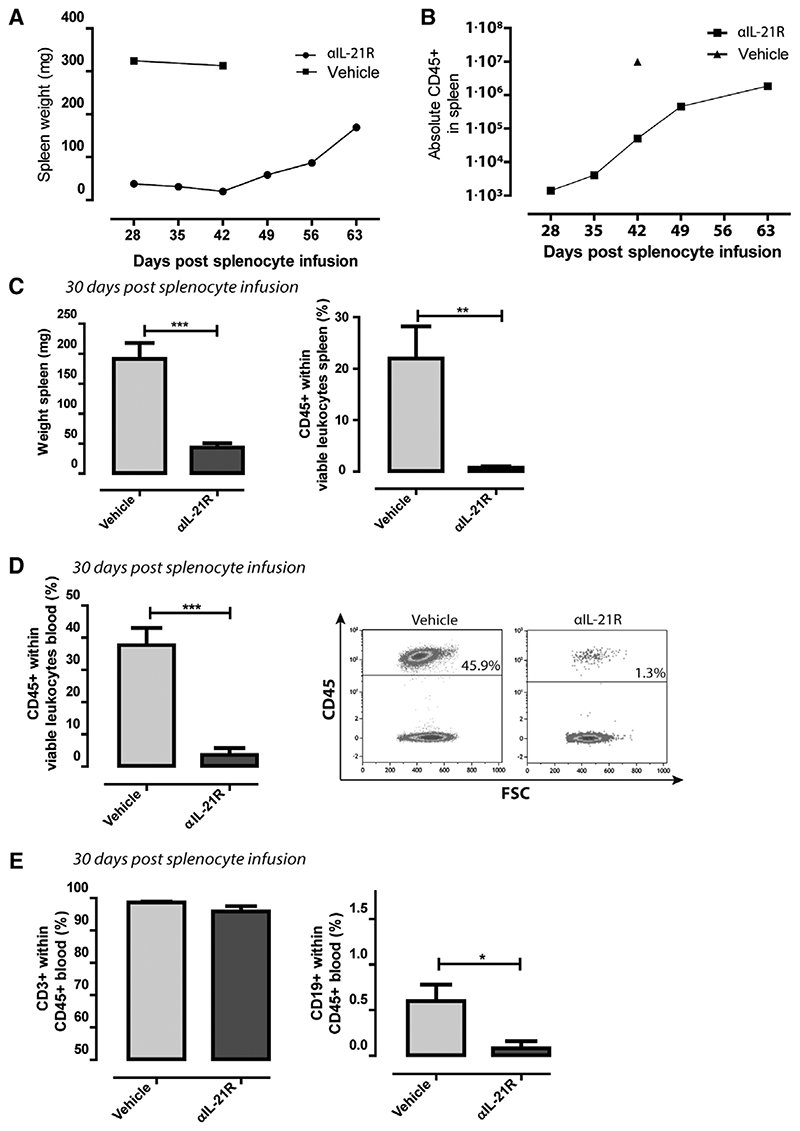
Figure 5. Anti-interleukin-21 receptor antibody (αIL-21R) mAb treatment affects human leukocyte engraftment.
A, Spleen weight in mg of mice treated following the schedule depicted in Figure 1A. Mice were euthanized on days 28, 35, 42, 49, 56, and 63 after adoptive cellular transfer. Two vehicle-treated animals were euthanized on days 28 and 42 after adoptive cellular transfer. n = 1 per time point. B, Absolute numbers of CD45+ lymphocytes of mice treated following the schedule depicted in Figure 1A. Mice were euthanized on days 28, 35, 42, 49, 56, and 63 after adoptive cellular transfer. One vehicle-treated animal was euthanized on day 42 after adoptive cellular transfer. n = 1 per time point. C, Spleen weight in mg and proportions of CD45+ human lymphocytes of the total viable leukocytes in the spleen. Measurements were performed 30 days after adoptive cellular transfer. D, Proportions of human CD45+ lymphocytes within the total viable leukocytes within blood of the vehicle-treated animals vs the αIL-21R-treated animals 30 days after adoptive cellular transfer. A typical example of a dot plot from a vehicle-treated animal and an αIL-21R-treated animals is depicted on the right-hand side. E, Proportions of CD3+ T cells and CD19+ B cells within human CD45+ lymphocytes in the blood. Vehicle-treated animals were compared to the αIL-21R-treated animals 30 days after adoptive cellular transfer. Vehicle group n = 7, αIL-21R group n = 8 (N.S. = not significant, *P < 0.05, **P < 0.01, ***P < 0.001).

