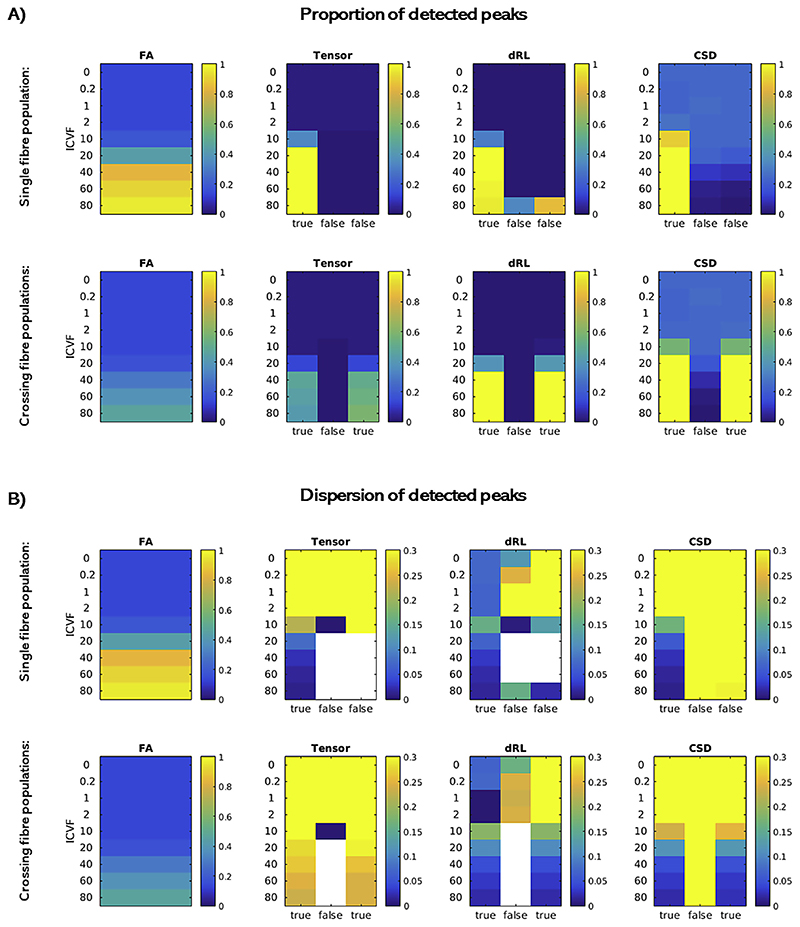
Fig. 1. Comparison of the three fibre orientation reconstruction algorithms in simulated data.
Simulated substrates varied in their intracellular volume fraction (ICFV). The parallel cylinders in each substrate were aligned with the z-axis (single fibre population), or with the z- as well as the y-axis (crossing fibre populations). A: For each approach (tensor-based, dRL and CSD), we calculated the percentage of all voxels within each substrate type for which the ‘true’ underlying fibre configuration peak(s) could be detected. As a control, we also calculated this percentage for ‘false’ peaks (orthogonal to the true peak(s)). In each case, the left-most plot shows the FA for each substrate type. B: Dispersion across all detected peaks of a substrate type was calculated. Dispersion was high across wrongly detected peaks, while for substrates with higher intracellular volume fraction, the true detected peaks by dRL and CSD consistently showed dispersion of < .15.

