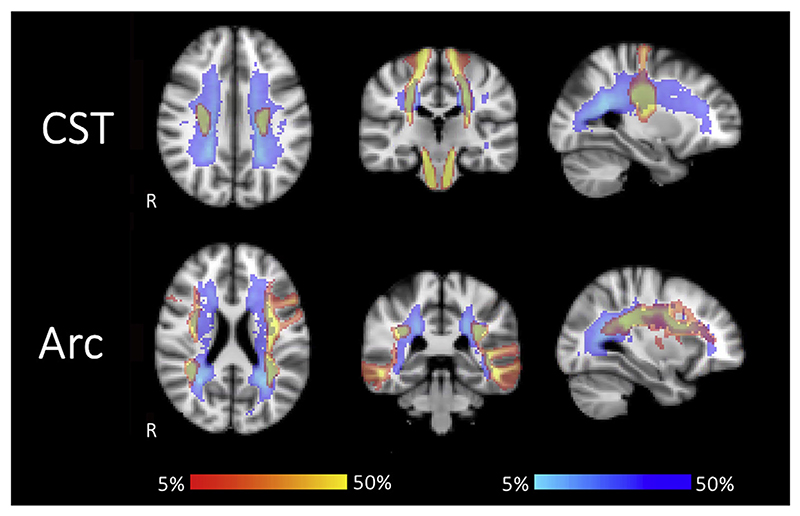
Fig. 3. Tract probability.
Tract probability maps for patients (red-yellow) are overlaid with lesion probability maps (blue-lightblue). Data from 123 to 130 patients contributed to the map for the left and right CST, respectively, and data from 130 to 122 patients contributed to the map for the left and right Arc, respectively. The lesion probability map is the same as reported in Lipp et al. (2019). Both maps are thresholded between 5 and 50%. Maps for the CST (top) and Arc (bottom) show that areas of high lesion probability overlap with the tracts. This suggests that the investigated tracts go through areas with increased likelihood of lesions, potentially affecting the tracking. R indicates the right hemisphere. Acronyms: CST: cortico-spinal tract, Arc: arcuate fasciculus.

