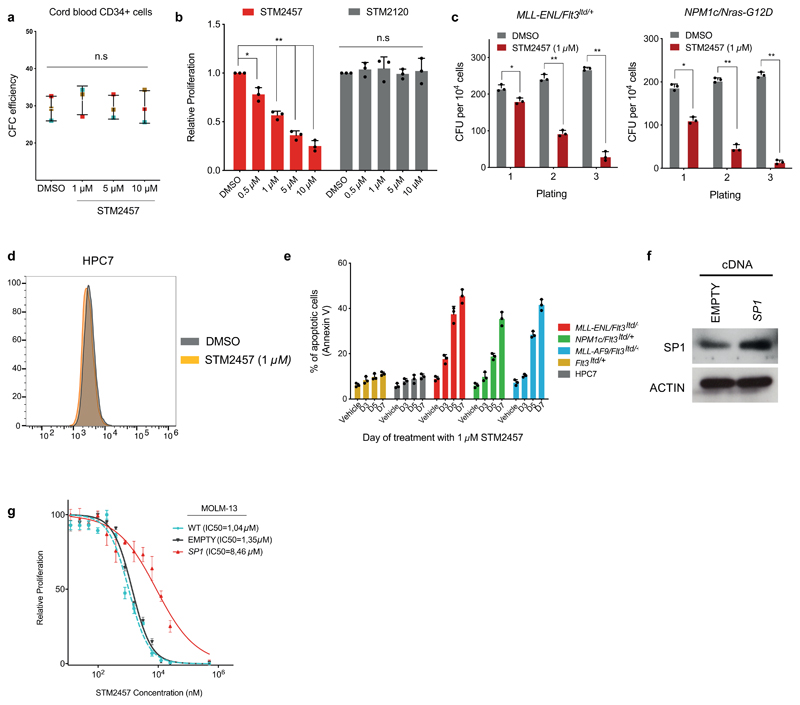
Extended Data Figure. 3. Treatment with STM2457 triggers colony forming deficiency and apoptosis in AML cells.
a) Colony-forming efficiency of CD34+ human cord blood cells (n?=?3) in the presence of 1, 5, or 10?µM STM2457 (mean?±?s.d., n=3). These changes are not significant at the 95% confidence level according to one-way Anova on repeated measures. Error bars refer to variation across 3 different individuals (blue, brown and red square). b) Proliferation assay in MOLM-13 cells after treatment with the indicated doses of STM2457 and STM2120, illustrating no sensitivity to the latter at any tested dose (mean ± s.d., n=3). c) Colony forming efficiency of primary murine MLL-ENL/Flt3ITD/+ and NPM1c/NRAS-G12D AML cells treated with 1 μM STM2457 showing decreased clonogenic potential compared with vehicle-treated (DMSO) controls (mean ± s.d., n=3). d) Mac1 levels were used to assess differentiation of non-leukaemic haemopoietic cell line HPC7. Flow cytometry comparison on day 4 post-treatment between vehicle (DMSO) and 1 µM STM2457. e) Selective increased apoptosis in AML cells but not in non-leukaemic haematopoietic cells, following treatment with 1 µM of STM2457 at the presented time points (mean ± s.d., n=3). f) Western blot for SP1 and ACTIN in MOLM-13 cells transduced with plasmids expressing SP1 cDNA or an empty control (n=3). g) Dose-response curves of MOLM-13 cells to STM2457 after transduction with vectors expressing SP1 cDNA or an empty control, showing selective decrease of drug sensitivity upon ectopic expression the former. The dose-response curve of parental MOLM-13 (WT, light blue) shown in Fig. 2a is illustrated for comparison purposes. (mean ± s.d., n = 3). d, days; two-tailed Student’s t-test; *P < 0.05, **P < 0.01

