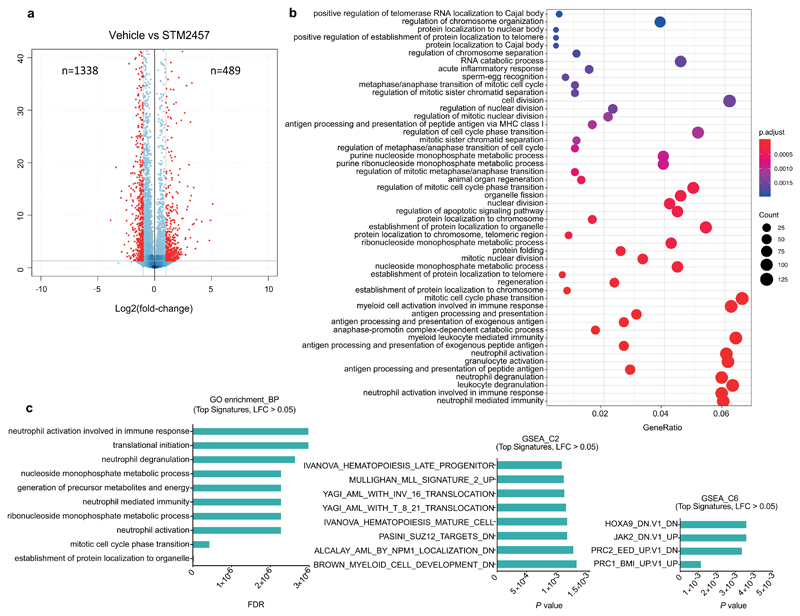
Extended Data Figure. 4. Differential expression analysis of AML cells after treatment with STM2457.
a) Volcano plot for MOLM13 cells treated with 1 µM STM2457 versus control samples after 48 hours of treatment, showing significantly dysregulated genes in red (Padj = 0.01). b) Extended gene ontology analysis of the differentially expressed genes post-treatment with 1 µM STM2457 in MOLM-13 cells. c) Representative GO signatures of the differentially expressed genes post-treatment with STM2457 in MOLM-13 cells. LFC, Log Fold Change.

