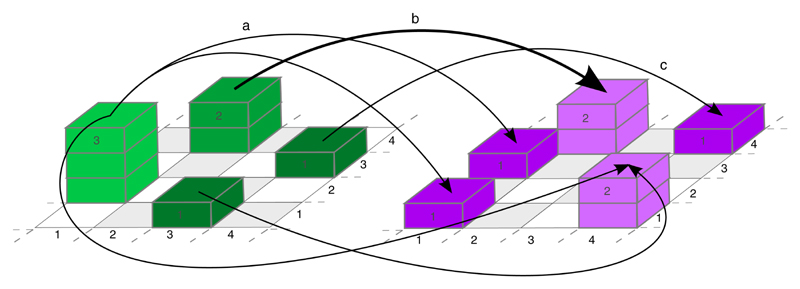
Fig. 2 |. Illustration of optimal transport based on two protein distributions.
The thickness of the arrows indicates how many particles from protein distribution A (left, green) are matched to corresponding particles in protein distribution B (right, magenta). Examples: arrow a indicates that one particle from the green stack of size three located at (1, 2) is matched with the magenta particle located at (1, 3) (mass splitting). Arrow b shows that the green stack of size two at (2, 4) is matched with the magenta stack of size two at the same location (no transport). Arrow c shows that the green stack of size 1 at (4, 3) is matched with the magenta stack of size one located at (4, 4) (shift).

