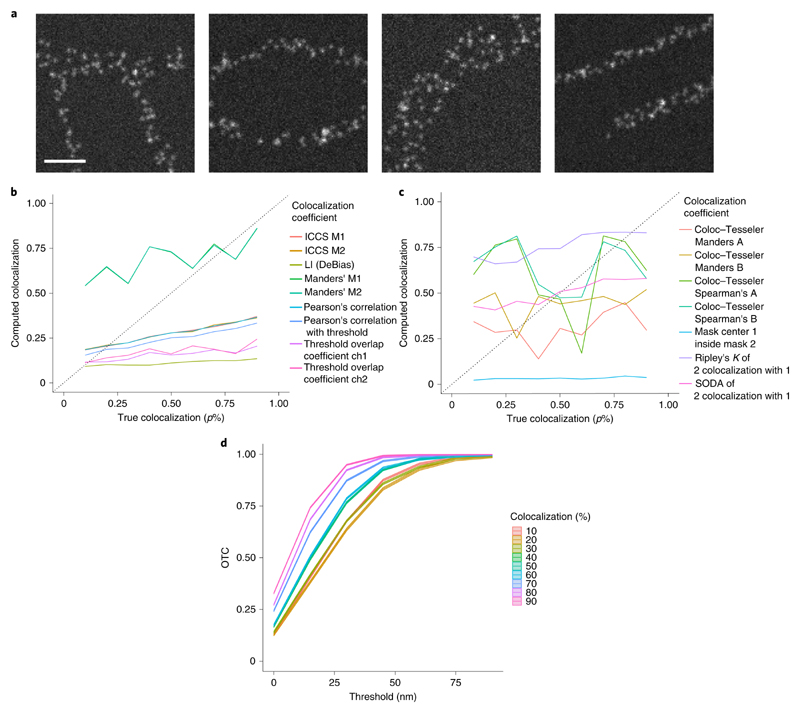
Fig. 4 |. Evaluation of simulated images with sparse structures.
a, Exemplary images of the simulated structures. Scale bar, 500 nm. b, Evaluation of n = 5 image sections per structure and per true colocalization (p%) with pixel-based methods. ICCS M1/M2 yield the same results as Pearson’s correlation with threshold. Furthermore, Manders’ M1 and M2 calculate the same amount of colocalization. For the threshold overlap coefficient ‘ch’ abbreviates channel. c, Evaluation of n = 5 image sections per structure and per true colocalization (p%) with object-based methods. d, OTC analysis including 95% confidence bands of n = 5 image sections per structure and per true colocalization (p%).

