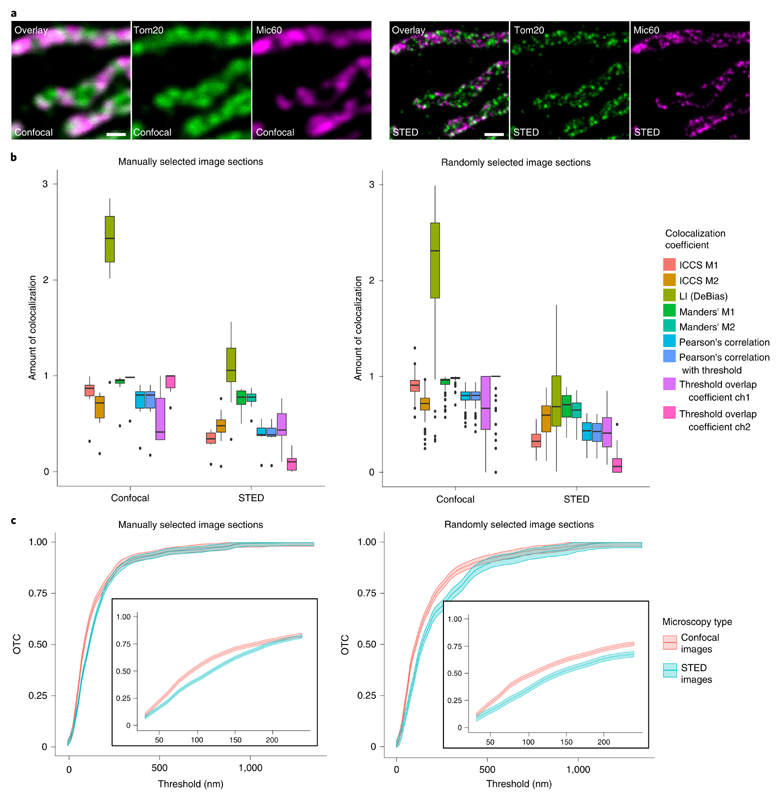
Fig. 5 |. Comparison of pixel-based methods and OTC for confocal and STED images.
a, Exemplary confocal (left) and STED (right) nanoscopy images of Tom20 and Mic60 in HDFa. Tom20 and Mic60 were labeled via antisera specific for Tom20 and Mic60 respectively. Detection was facilitated through secondary antibodies custom labeled with the dyes Alexa Fluor 594 or Abberior STAR RED. Scale bar, 500 nm. b, Colocalization analysis of Tom20/Mic60 in HDFa cells with pixel-based methods. Left: analysis of n = 10 manually picked image sections per protein. Numeric values of the boxplot elements are provided in Supplementary Table 2. Right: analysis of n = 102 randomly selected image sections. Numeric values of the boxplot elements are provided in Supplementary Table 3. For the threshold overlap coefficient ‘ch’ abbreviates channel. c, OTC analysis of Tom20/Mic60 including 95% confidence bands in HDFa cells. Left: analysis of n = 10 manually picked image sections. Right: analysis of n = 102 randomly selected image sections. The inserted graphs show magnifications of the treshold region [30 nm, 250 nm].

