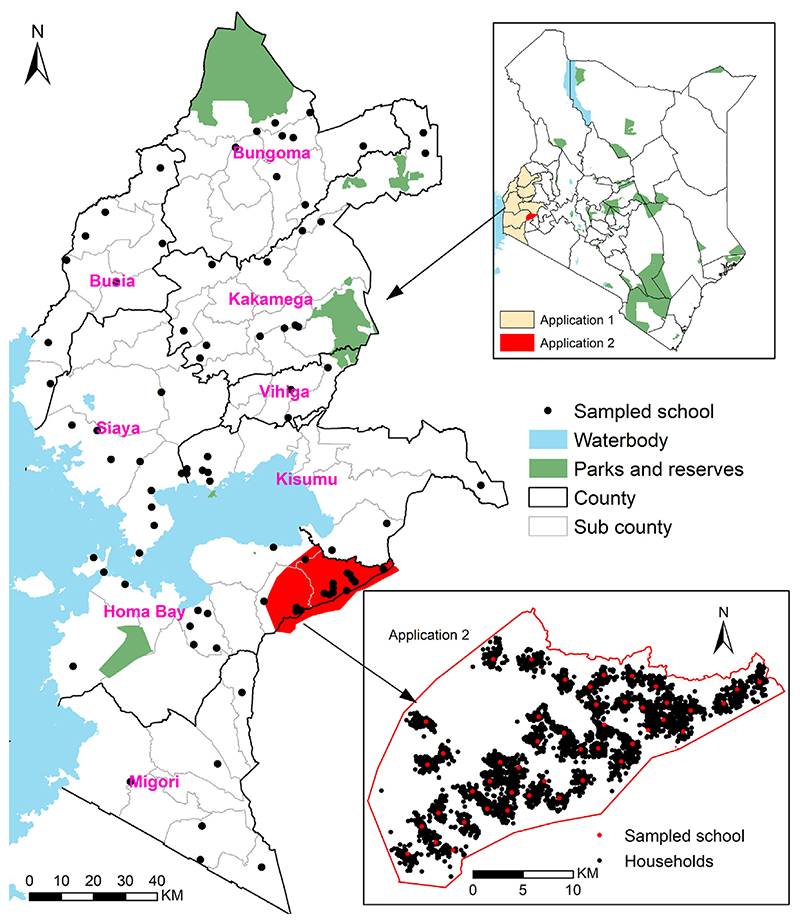
Fig. 1.
Study areas of the applications of Sections 3 and 4, both located in Western Kenya. Solid black (counties) and light grey (sub-counties) lines represent administrative units. The map in the lower right corner shows the study area and sampled households from the application of Section 4.

