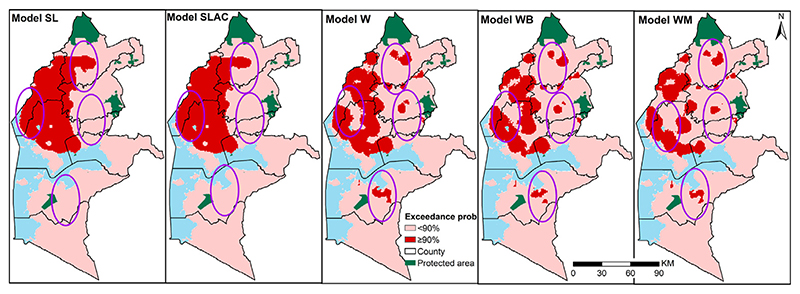
Fig. 6.
Maps of the predicted exceedance probability for a 30% prevalence threshold with a 90% probability on a 1 by 1 km regular grid in Western Kenya in 2009 for 2 standard statistical models (SL and SLCA) and three models accounting for locations uncertainty W, WB, WM. Ellipses show areas with differences. The protected areas are shown in green.

