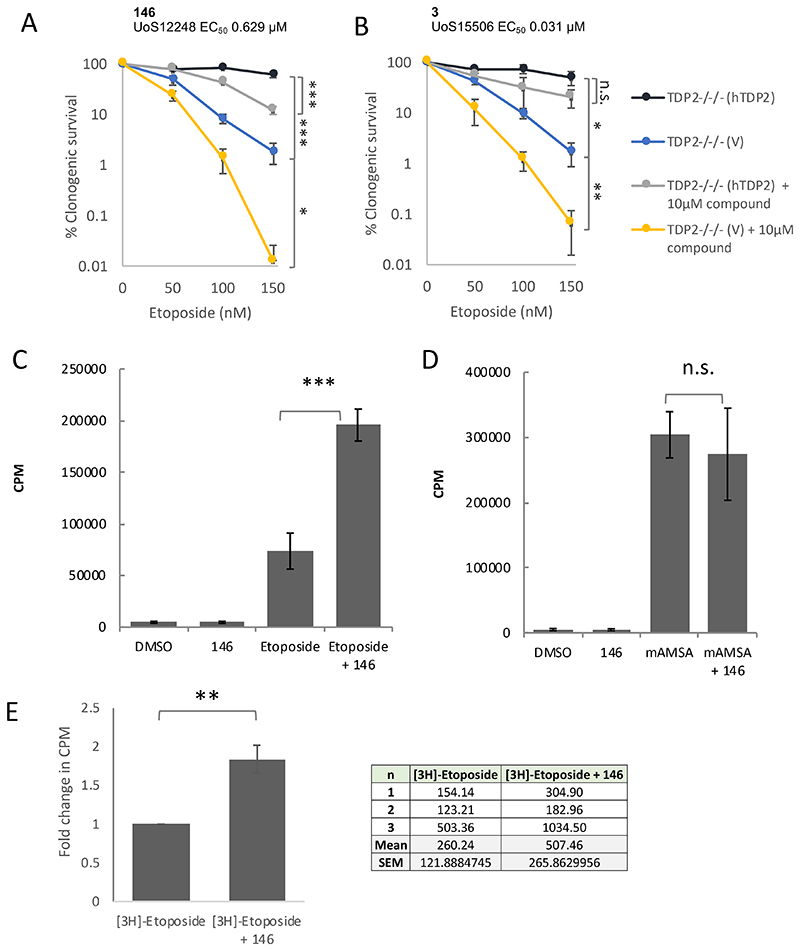
Fig.2. Deazaflavins can affect the cellular retention and toxicity of etoposide independently of TDP2 status.
A, TDP2-/-/- chicken DT40 cells stably transfected with empty vector (TDP2-/-/- (V)) or with expression construct encoding human TDP2 (TDP2-/-/-(hTDP2) were treated for 7-10 days with the indicated concentrations of etoposide, in the absence or presence of the deazaflavine 146. Visible colonies were counted, and clonogenic survival plotted as in Fig.1. Data are the mean +/- SEM of 3 independent experiments, and statistically significant differences (*p<0.05, **p<0.005, ***p<0.0001) between survival curves were measured by ANOVA. B, The indicated TDP2-/-/- chicken DT40 cells were treated with etoposide in the absence or presence of the deazaflavine, 3, as described above. C & D, The impact of deazaflavin on induction of TOP2 cleavage complexes by etoposide (B) and m-AMSA (C). A549 cells pre-labelled with [3H]-thymidine were treated with DMSO vehicle or 146 for 1 hr and then for a further 1 hr in the presence of 30μM etoposide or 5μM m-AMSA. Covalent TOP2-DNA complexes were quantified by the amount of [3H]-thymidine labelled DNA (CPM) present in cellular protein precipitates. Data are the mean +/- SD of 3-4 independent experiments, and statistically significant differences were determined by Student’s t-test (***p=0.009). E, Impact of the deazaflavin compound 146 on etoposide uptake and/or retention in A549 cells. Cells were pre-treated with DMSO vehicle or10 μM 146 for 60 min followed by a further 60 min in the additional presence of 10 μCi [3H]-etoposide. The tritium present in each cell sample was quantified by scintillation counting and the results were normalized to the [14C]-thymidine content of each sample. The fold change in normalised [3H]-Etoposide CPM in the presence of deazaflavin, relative to that in the absence of deazaflavin, was plotted. Data are the mean of 3 independent experiments. (**p=0.002,, Student’s t-test), and the normalised 3H counts observed in each individual experiment are shown in the table.

