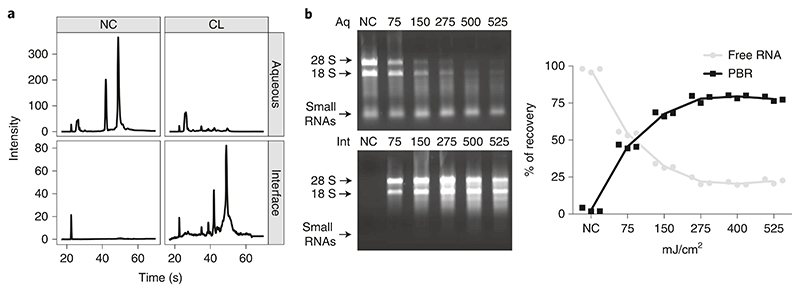
Fig. 5. OOPS RNA recovery.
a, Representative Bioanalyzer RNA profile in the aqueous phase and interfaces of non-cross-link (NC) and cross-link (CL) samples (adapted from ref. 5), after proteinase-K digestion. b, Left: representative image of a 1% agarose (wt/vol) gel showing the main ribosomal RNA bands; UV dosage in mJ/cm2 is indicated per column (top: first aqueous phase (Aq; free RNA); bottom: interfaces (Int; protein-bound RNA)). Right: relative RNA cross-link proportion at different UV dosage measured using Nanodrop (n = 3), adapted from ref. 5.

