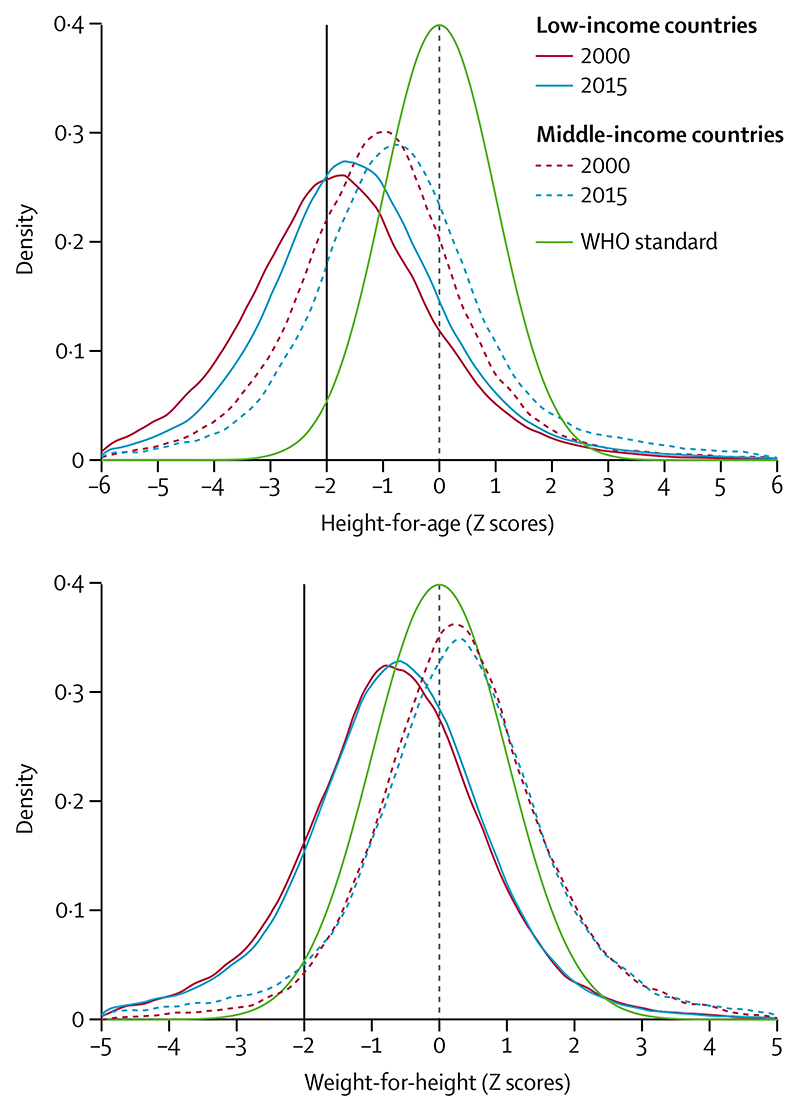
Figure 2. Height-for-age and weight-for-height distributions of children younger than 5 years, from 2000 and 2015.
The green curves show the WHO child growth standards. The black vertical lines correspond to the traditional cutoff Z scores of −2. Data are for 31 low-income countries and 19 middle-income countries, taken from Demographic and Health Surveys and Multiple Indicator Cluster Surveys (appendix pp 1-5). We refer to data collected from 1996 to 2005 as 2000 data, and data collected from 2010 to 2018 as 2015 data.

