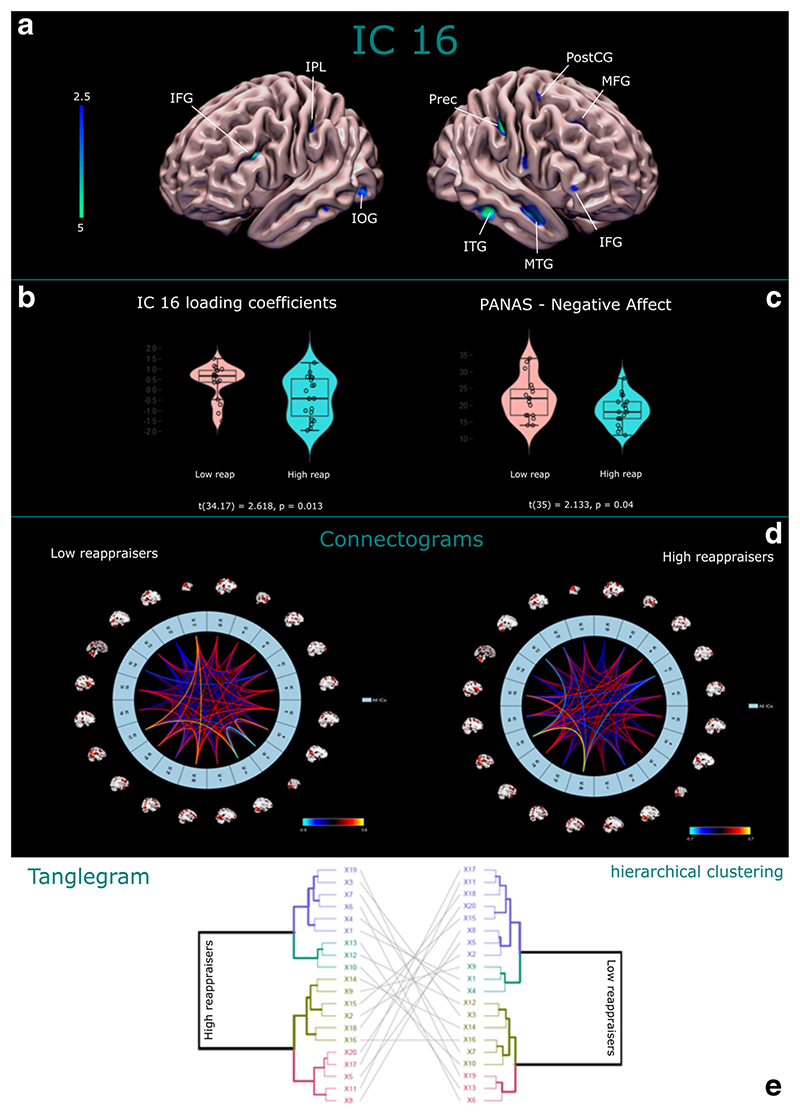
Fig. 1.
a-b) Visual rendering of IC16 and IC16 loading coefficients distribution between groups. c) Violin boxplots of PANAS-NA scores distribution among low and high reappraisers; c) Connectograms of the structural network correlations matrices for low and high reappraisers; d) Tanglegram between the dendrograms of R1 (high reappraisers, on the left) and R2 (low reappraisers, on the right). Note that the lines among nodes indicate how much the dendrograms entangle

