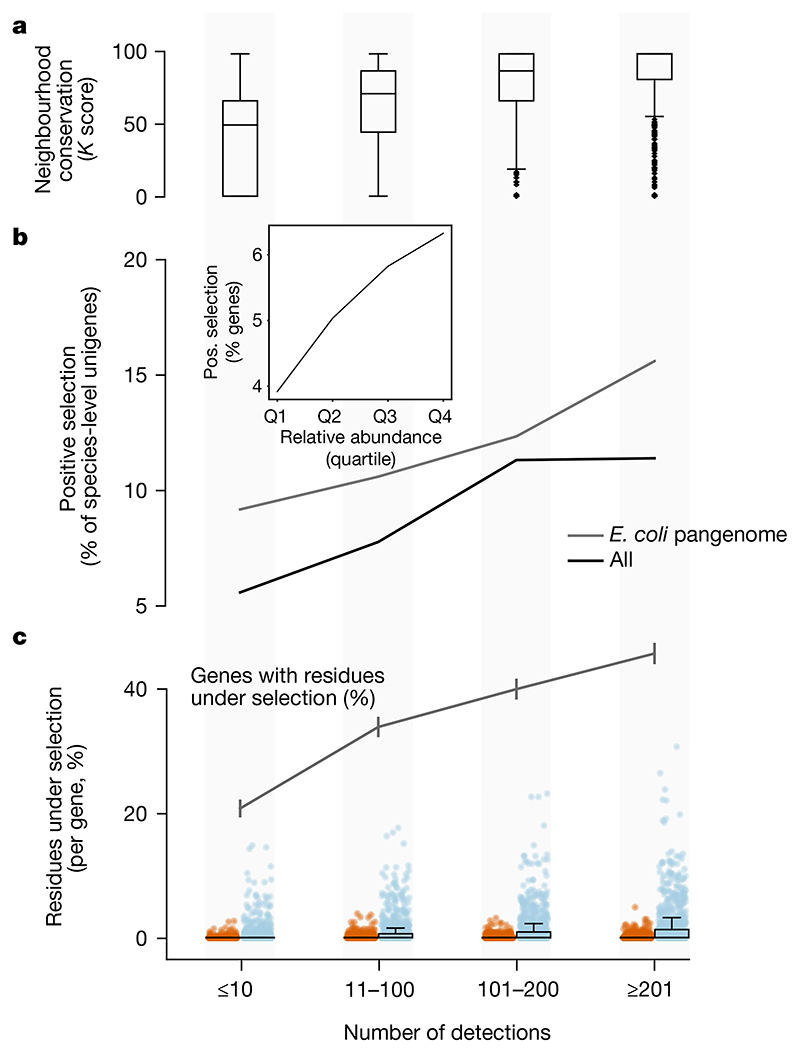
Fig. 4. Rare unigenes are under lower selection pressure.
a, The operon structure is more frequently preserved in prevalent genes (estimated using genetic neighbourhood relations (Methods)). b, The fraction of unigenes under detectable positive selection (using the HyPHY aBS-REL method (Methods)) increases with the number of detections. This also holds in the E. coli pangenome. Inset, due to the correlation of prevalence and abundance, less-abundant genes are under lower selective pressure than more highly abundant ones (data are split into relative abundance quartiles). c, The E. coli pangenome is the only one of sufficient size to test for selection per site. High-prevalence genes within the E. coli pangenome show evidence of stronger negative (blue) and positive (red) selection than rare genes (fewer detections in GMGCv1) per site. Box plots and dots show the fraction of residues under significant selection per unigene over the total alignment length (n = 4,167 for each category). The grey line shows the fraction of genes with at least one residue under selection (error bars indicate s.e.m.). Despite this overall trend we observed evidence of strong selection in a few rare E. coli genes. For example, we found instances of the UDP-glucose 6-dehydrogenase gene, which contributes to antibiotic resistance, with evidence of selection despite being observed in only six samples. Box plots show the median and the quartiles, with whiskers extending to the furthest data points (excluding outliers, detected using Tukey’s rule).

