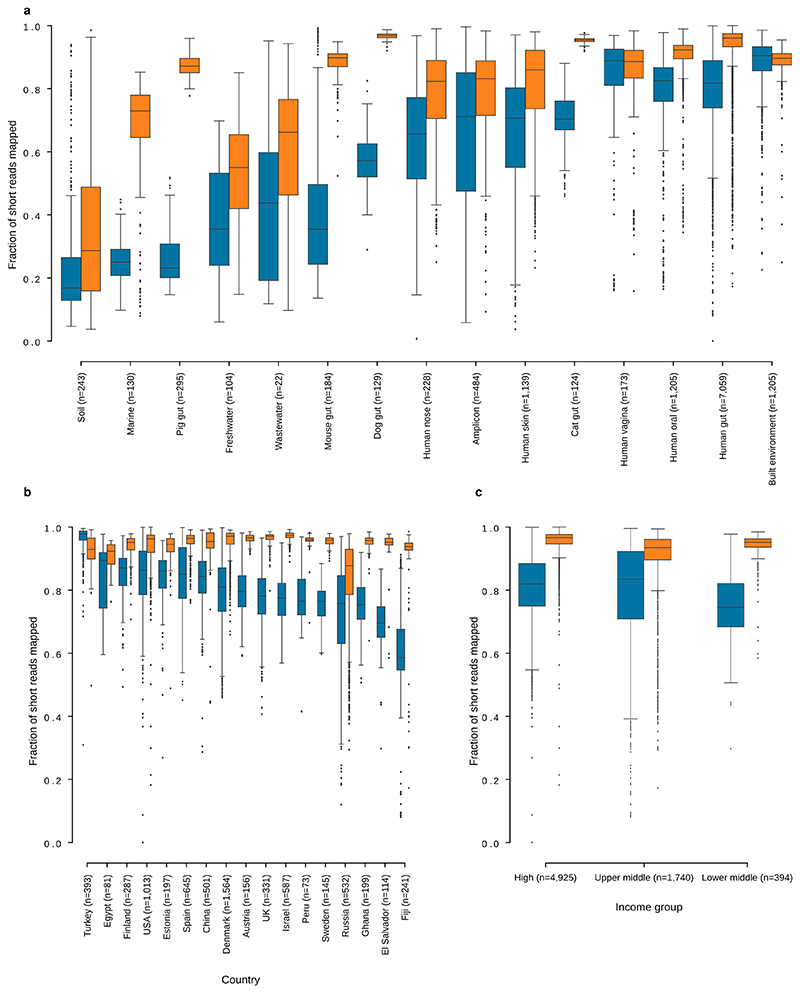
Extended Data Fig. 3. Short reads map to the GMGCv1 at higher rates (compared to a reference database of reference genomes).
(a) Mapping rates for short reads from metagenomes mapped against the GMGCv1 or the reference genomes in proGenomes2. (b) Fraction of short reads from human gut metagenomes mapping to a collection of sequenced genomes and the GMGCv1, per country, (c) Same data as (b), aggregated by the World Bank’s classification of countries into income groups. In all panels, boxplots show quartiles (including median) and range (except for outliers, see Methods). Blue boxes show mapping rates to proGenomes2, while orange boxes show mapping rates to GMGCv1.

