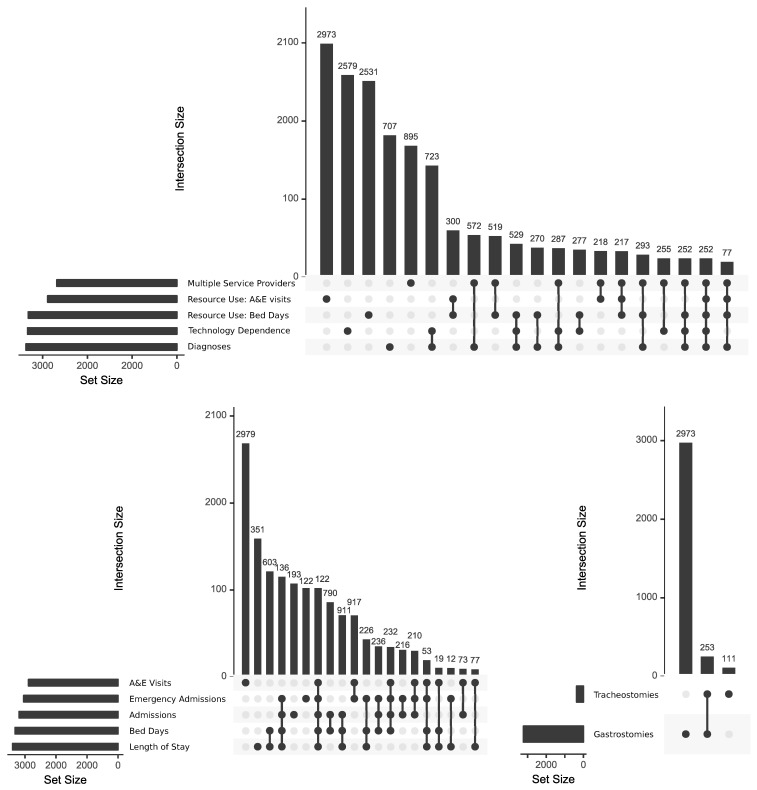
Figure 10. UpSet graphs showing relations between measures of complexity.
Intersections between (top) those in approximately the top 10% for each of five indicators of complexity; (bottom left) those in approximately the top 10% in each of the five indicators of high resource use; (bottom right) those with technology dependence. For simplicity, only the largest 20 intersections are shown.

