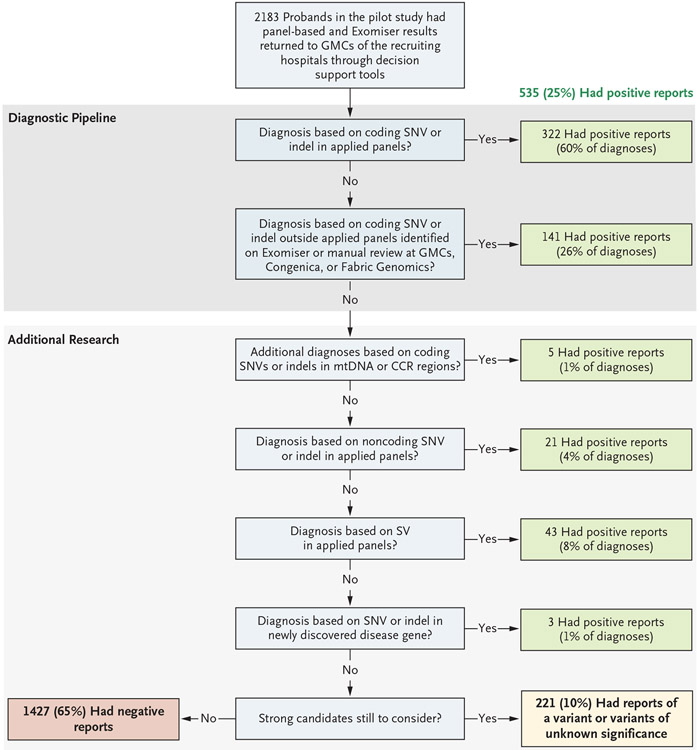
Figure 1. Overview of the Diagnostic and Research Pipeline and Source of Diagnoses.
Results from 2183 probands in the pilot study were returned for presentation to the Genomic Medicine Centres (GMCs) of the recruiting hospitals. A total of 25% of the probands received a positive diagnosis, and 10% had a variant or variants of unknown significance in genes that were determined by clinical geneticists at the recruiting site to be consistent with the phenotype but that required further functional validation. The remaining 65% of the probands received a negative report at the time but will be reassessed. The numbers and sources of these positive diagnoses are shown at each stage of the automated diagnostic pipeline, and the additional research is shown for diagnoses that were not immediately obvious. CCR denotes constrained coding region, indel insertion or deletion, mtDNA mitochondrial DNA, SNV single-nucleotide variant, and SV structural variant.

