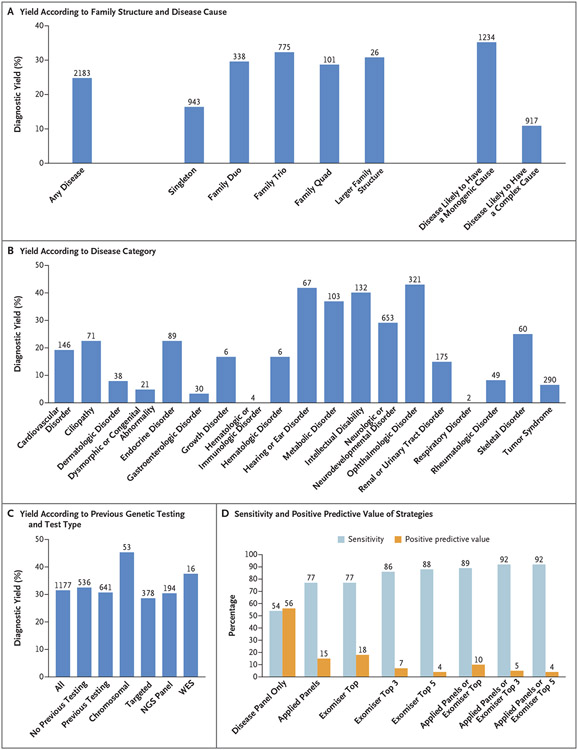
Figure 2. Diagnoses in the Rare Disease Pilot Study.
Panel A shows diagnostic yield for any disease and according to family structure and cause of disease. The diagnostic yield was 35% for diseases likely to have a monogenic cause and 11% for diseases likely to have a complex cause. The values above the bars are the numbers of probands. Singleton refers to a proband for whom no other family member was recruited, family duo to a parent–proband pair, family trio to both parents and a proband, and family quad to a proband, sibling, and parents. Panel B shows diagnostic yield according to disease category. The values above the bars are the numbers of probands. Panel C shows the diagnostic yield among probands according to previous genetic testing and most extensive testing type: chromosomal (karyotyping, array-based comparative genomic hybridization, single-nucleotide polymorphism arrays), targeted (targeted single-gene tests), next-generation sequencing (NGS) panels, or whole-exome sequencing (WES). The values above the bars are the numbers of probands. Panel D shows the performance of virtual panel-based and Exomiser-based prioritization for identifying the diagnoses. “Disease panel only” indicates the use of a single virtual panel for the recruited disease category. “Applied panels” indicates the use of all applied virtual gene panels used in the pipeline, including the recruited disease–associated panel as well as 0 or more additional panels selected on the basis of the patient’s phenotypes (Human Phenotype Ontology terms). “Exomiser top” indicates Exomiser use in the top-ranked candidate variants, “Exomiser top 3” use in the top three candidates, and “Exomiser top 5” use in the top five candidates. Sensitivity is the percentage of true positive diagnoses based on SNVs or indels that were identified, and the positive predictive value is the percentage of prioritized variants that led to a positive diagnosis. The values above the bars are percentages. In this analysis, the diagnosed variant or variants are true positives, and the other candidate variants that were returned are false positives.

