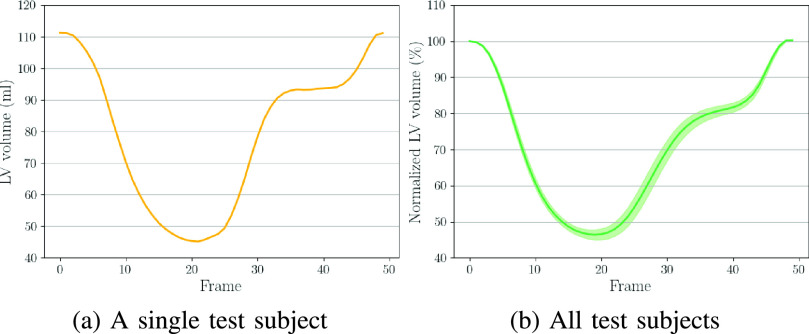
Fig. 6.
The results of LV volume across the cardiac cycle. (a) Results on a randomly selected test subject. (b) Results on all test subjects (mean values and confidence interval are presented). Note that, for each subject in (b), we normalized LV volume (dividing LV volume in all time frames by that in the ED frame) and show the average results of all test subjects.

