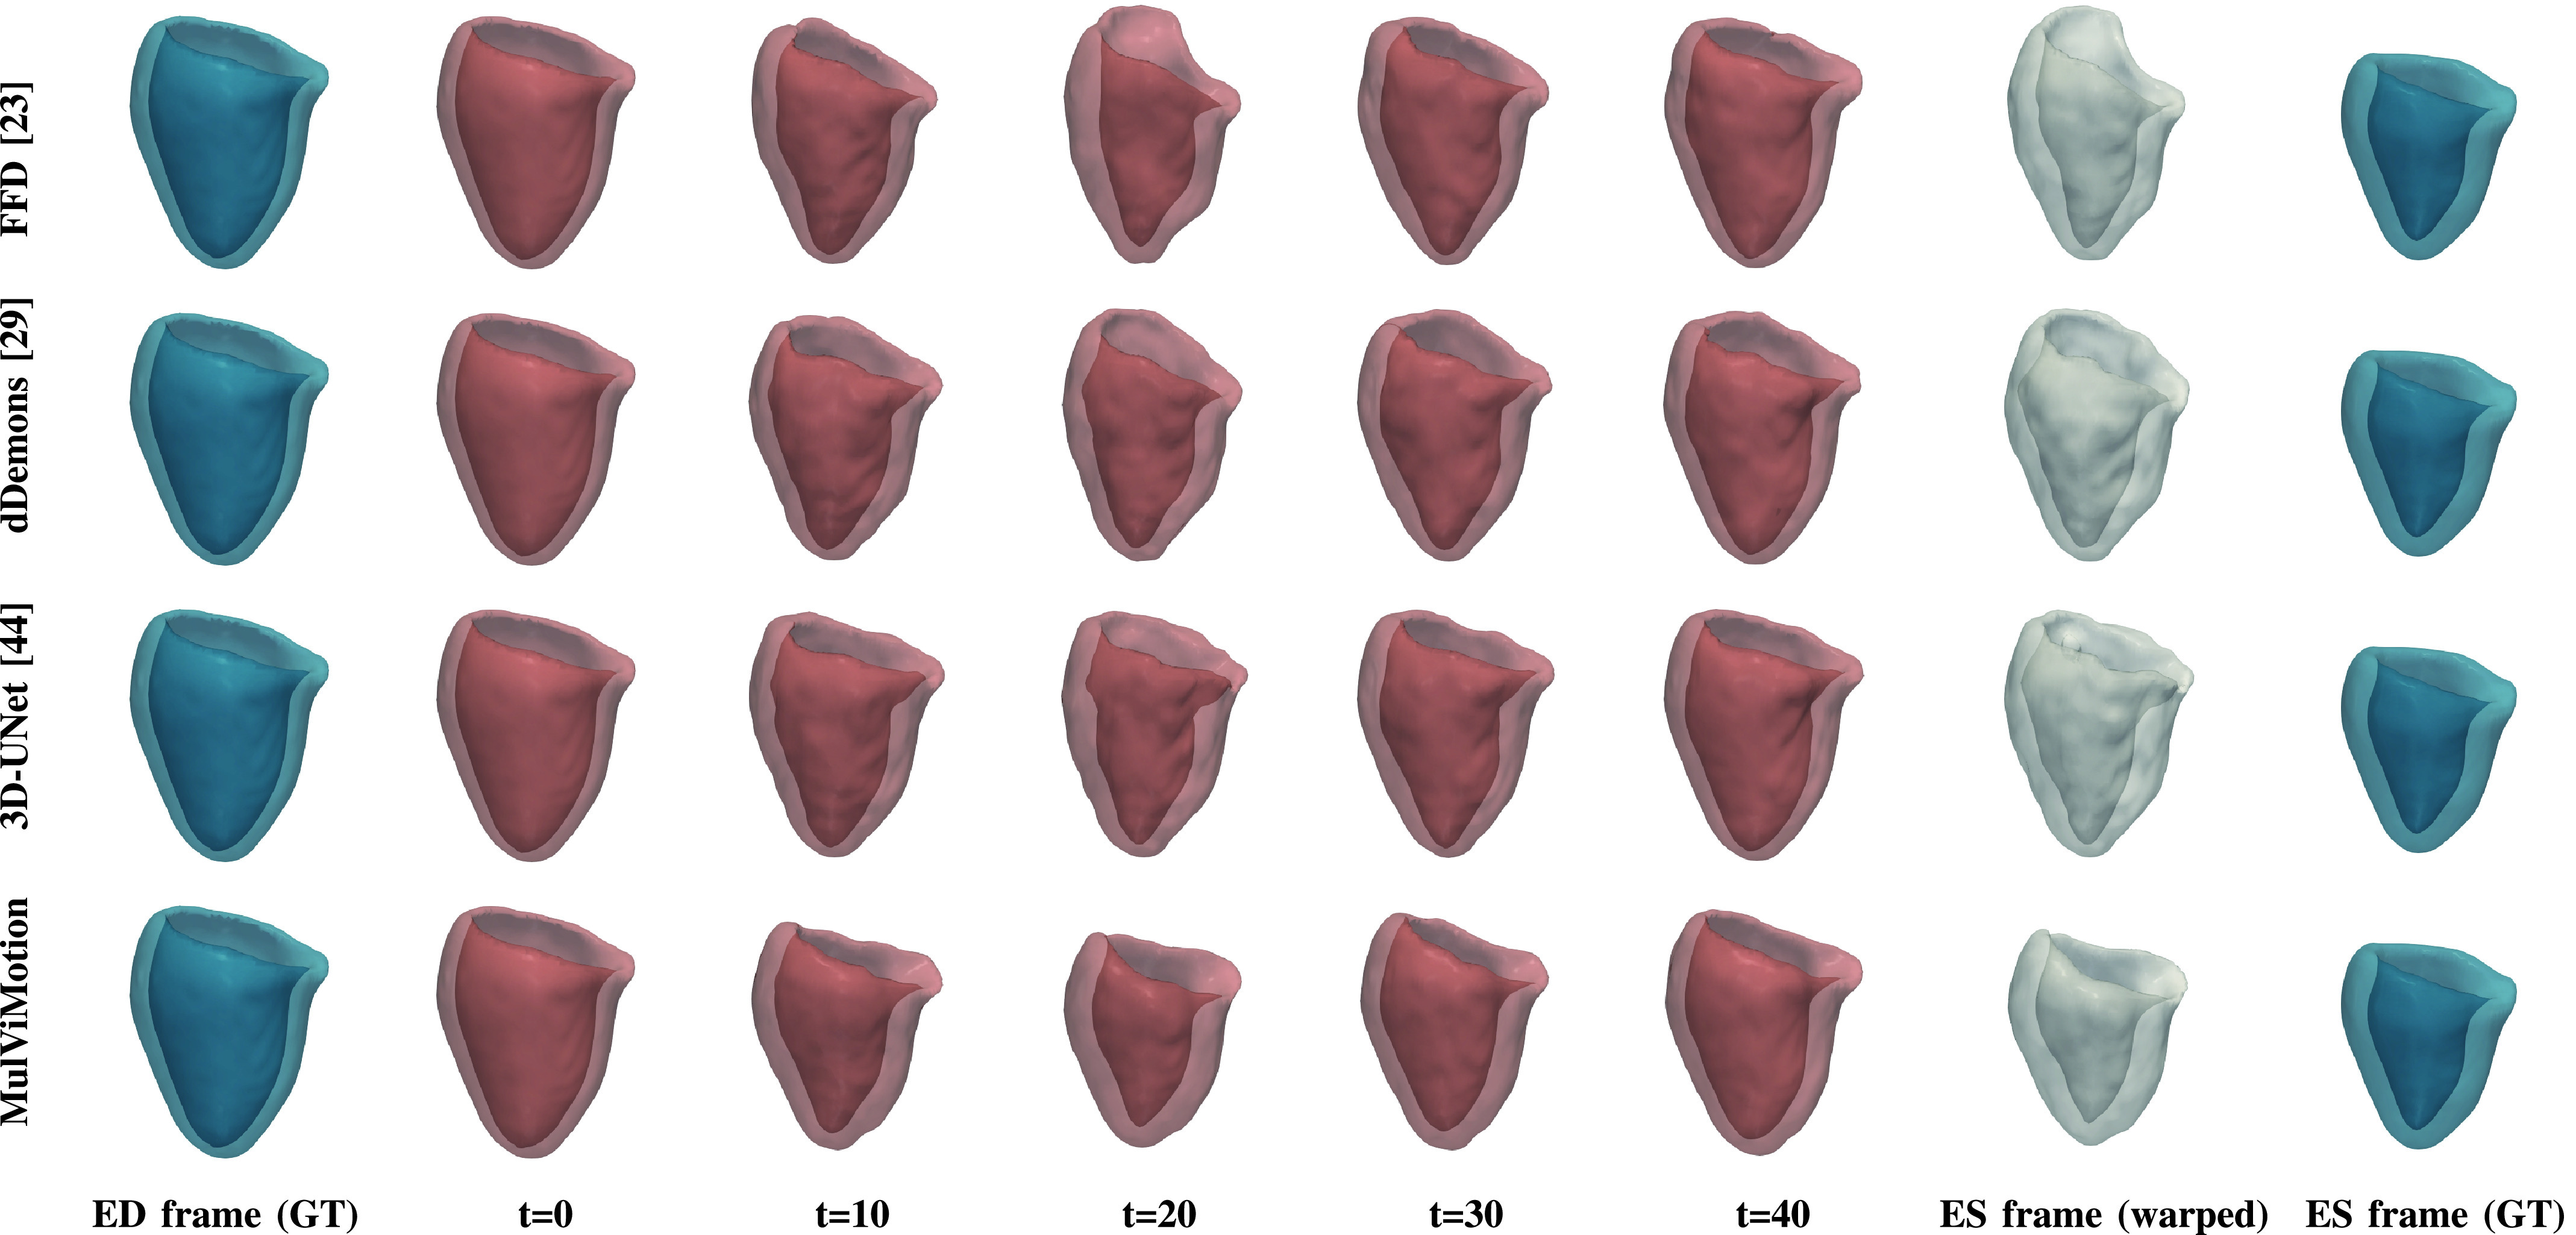
Fig. 7.

3D visualization of motion tracking results using the baseline methods and MulViMotion. Column 1 (blue) shows the ground truth (GT) meshes of ED frame. Columns 2-6 (red) show 3D motion tracking results across the cardiac cycle. These meshes are reconstructed from the warped 3D segmentations (warped from ED frame to different time frames). Column 7 (white) additionally shows the reconstructed meshes of ES frame from the motion tracking results and Column 8 (blue) shows the ground truth meshes of ES frame.
