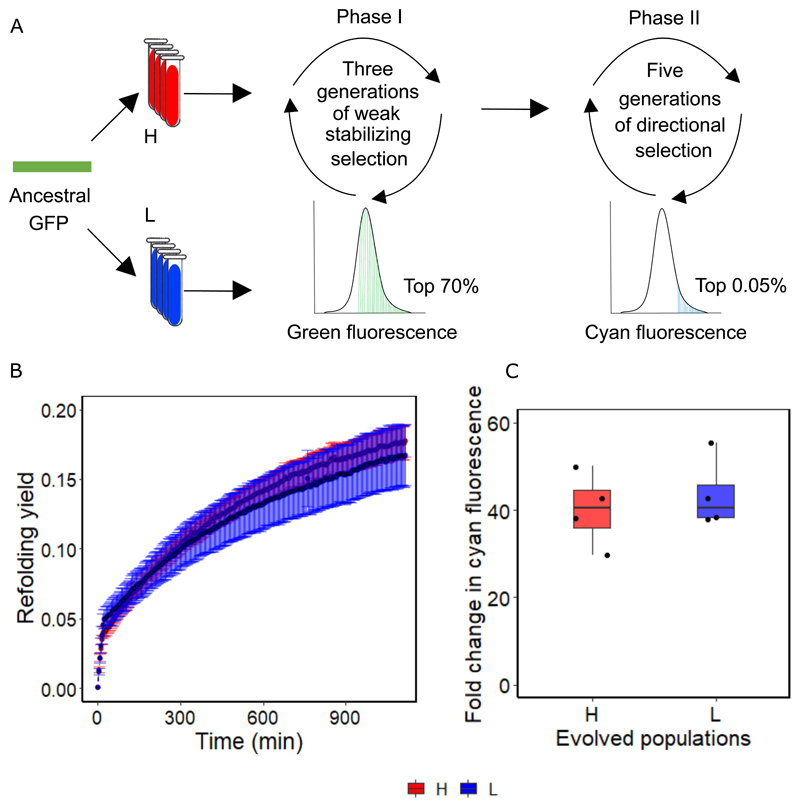
Figure 4. Evolvability of GFP becomes indistinguishable in H and L populations when the starting population is robust to destabilizing variants.
A. We evolved eight replicate populations (four at high expression level, and four at the low expression level) in two phases. In the first phase we imposed weak stabilizing selection on green fluorescence, where we allowed the top 70% of green fluorescing cells to survive. This phase lasted three generations. In the second phase we imposed strong directional selection on cyan fluorescence, as in our main experiment (Figure 1A). B. Refolding yield measured over 1000 minutes for GFP in L and H populations after three generations of stabilizing selection. Black lines (composed of circles) denote the average refolding yield over four replicates, while error bars indicate one standard deviation of the mean. Stabilizing selection has rendered refolding yield statistically indistinguishable between H and L populations (p = 0.24, two-sample t-test, Methods). C. Fold change in cyan fluorescence, compared to ancestral GFP, after five generations of second phase of directed evolution in four H and four L populations. Stabilizing selection has rendered the fold change in cyan fluorescence statistically indistinguishable between L and H populations (two-tailed unpaired t-test, n=4, p = 0.58, Cohen’s d=0.41±1.75, t=-0.58, 95%CI= -17.89, 10.9, df= 5.98, Methods). The box represents the interquartile range, while the solid line represents the median. The whiskers extend to the lowest and the highest value in the dataset while each circle represents an evolved population. Red and blue represent H and L populations, respectively.

