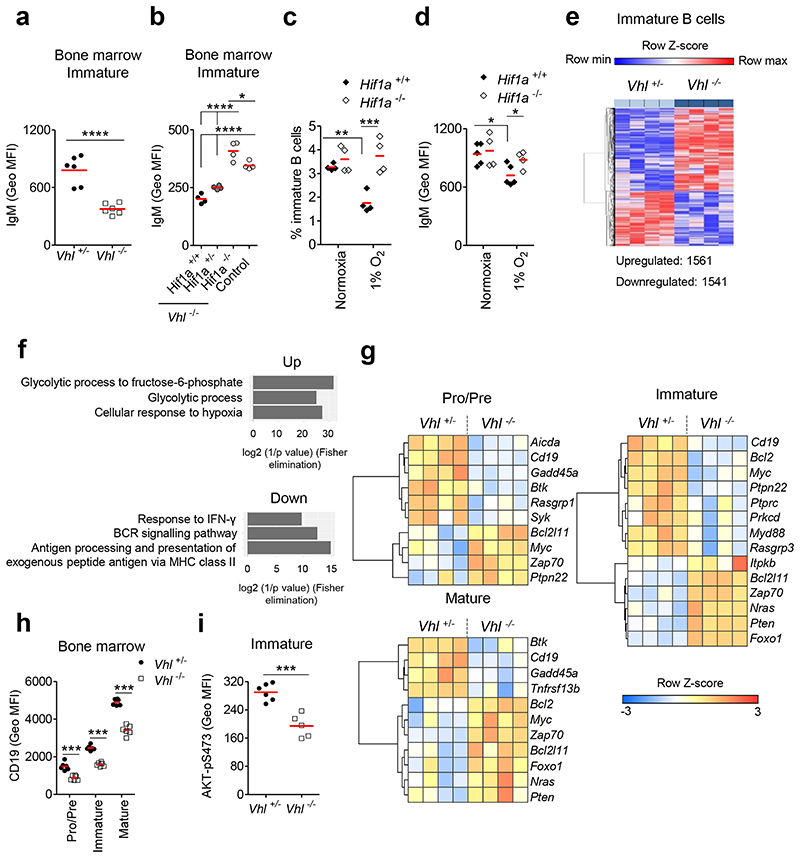
Figure 4. Defects in development linked to BCR signaling.
Surface (s)IgM expression (Geo MFI) on immature B cells from (a) Vhl+/-Mb1-cre and Vhl-/-Mb1-cre mice, (b) Vhl-/-Mb1-cre mice carrying Hif1a+/+, Hif1a+/- and Hif1a-/- alleles, and control (Vhl+/-Hif1a+/+Mb1-cre) mice. (c) Frequency of live and (d) sIgM expression (Geo MFI) on Hif1a+/+Mb1-cre and Hif1a-/-Mb1-cre immature B cells cultured under normoxia or 1% O2 for 3d. (e) Heatmap of significantly differentially expressed genes in Vhl-/-Mb1-cre versus Vhl+/-Mb1-cre immature B cells (BH adjusted P<0.05). Columns represent individual mice. (f) Gene ontology (GO) analysis of significantly altered genes common to all Vhl-/-Mb1-cre BM B cells (Pro-B,Pre-B,immature,mature) when compared to Vhl+/-Mb1-cre controls. Top three GO terms (relevant to hypoxia and B cell biology) ranked by significance are plotted. (g) Heatmaps of row-scaled gene expression of selected differentially expressed transcripts in sorted BM B cells. Columns represent individual mice. Expression of (h) CD19 and (i) AKT-pS473 (Geo MFI) in BM B cells from Vhl+/-Mb1-cre and Vhl-/-Mb1-cre mice. (a-d,h-i) Gated as in Figure 1b. (e-g) Gated as in Figure 3a. (a,d,i) *P<0.05,***P<0.001,****P<0.0001 unpaired two-sided t test. (b) *P<0.05,****P<0.0001 one-way ANOVA Tukey post-test. (c,h) **P<0.01,***P<0.001 two-way ANOVA Bonferroni post-test. (a,h) n=6 per genotype, (b-c,e-g) n=4 per genotype, (d) n=5 Hif1a+/+Mb1-cre, 4 Hif1a-/-Mb1-cre and (i) n=6 Vhl+/-Mb1-cre, 5 Vhl-/-Mb1-cre, biologically independent mice. Data, (a) representative of nine independent experiments, (b-d) representative of at least two independent experiments, (e-g) from one experiment, (h) representative of six independent experiments, (i) representative of three independent experiments. (a-d,h-i) Symbols represent individual mice, bars means ± S.D.

