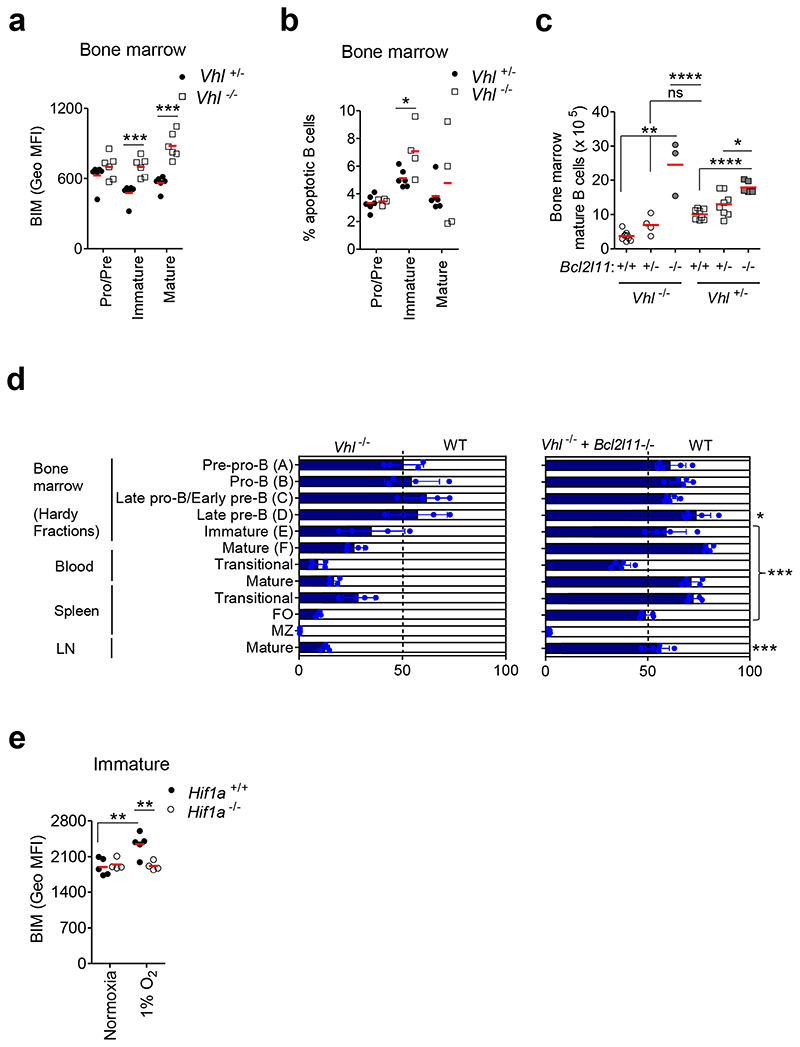
Figure 5. Developmental block linked to BIM-dependent survival.
(a) BIM expression (Geo MFI) in BM B cells from Vhl+/-Mb1-cre and Vhl-/-Mb1-cre mice. (b) Percentage apoptotic BM B cells from Vhl+/-Mb1-cre and Vhl-/-Mb1-cre mice, measured by PO-PRO-1 and 7-AAD staining. (c) Enumeration of BM mature B cells, by flow cytometry, from Vhl+/-Mb1-cre and Vhl-/-Mb1-cre mice carrying Bcl2l11+/+, Bcl2l11+/- and Bcl2l11–/– alleles. (d) The relative proportion of B cell subsets in lethally irradiated CD45.1 mice reconstituted for 8 weeks with 1:1 mixtures of CD45.1 WT and CD45.2 Vhl-/-Mb1-cre or Vhl-/-Mb1-cre+Bcl2l11–/– BM. Gated as in Figure 3c. Filled columns; mean %CD45.2, clear columns; mean %CD45.1. Error bars S.D.; comparison between Vhl-/-Mb1-cre and Vhl-/-Mb1-cre+Bcl2l11–/– BM by two-way ANOVA Bonferroni post-test *P<0.05,***P<0.001. (e) BIM expression (Geo MFI) in Hif1a+/+Mb1-cre and Hif1a-/-Mb1-cre immature B cells cultured in 1%O2 for 24h. Gated on (a-b) Pro-B, Pre-B B220+IgM-IgD-, (a-b,e) immature B220+IgM+IgD- and (a-c) mature B220+IgM+IgD+. (a,e) **P<0.01,***P<0.001 two-way ANOVA Bonferroni post-test. (b) *P<0.05 unpaired two-sided t test, (c) *P<0.05,**P<0.01,****P<0.0001 one-way ANOVA Tukey post-test. (a) n=6 per genotype, (b) n=6 Vhl+/-Mb1-cre and 4 Vhl-/-Mb1-cre, (c) n=9 Vhl-/-Mb1-cre+Bcl2l11+/+, 4 Vhl-/-Mb1-cre+Bcl2l11+/-, 3 Vhl-/-Mb1-cre+Bcl2l11–/–, 8 Vhl+/-Mb1-cre+Bcl2l11+/+, 8 Vhl+/-Mb1-cre+Bcl2l11+/- and 6 Vhl+/-Mb1-cre+Bcl2l11–/–, (d) n=4 WT:Vhl-/-Mb1-cre and 5 WT:Vhl-/-Mb1-cre+Bcl2l11-/- and (e) n=5 Hif1a+/+Mb1-cre and 4 Hif1a-/-Mb1-cre, biologically independent mice. Data, (a) representative of three independent experiments, (b) representative of two independent experiments, (c) pooled from three independent experiments, (d) from one experiment and (e) representative of two independent experiments. (a-e) Symbols represent individual mice, bars means ± S.D.

